[Die Herausforderung der leisen Sprache für Hörgeräteträger]
Michael Schulte 1Jan Heeren 1
Christophe Lesimple 2
Matthias Latzel 2
1 Hörzentrum Oldenburg gGmbH, Oldenburg, Germany
2 Sonova AG, Stäfa, Switzerland
Zusammenfassung
Die Wahrnehmung von Sprache bei niedrigen Pegeln unter 55 dB(A) hat in der wissenschaftlichen Literatur noch nicht viel Beachtung gefunden. Insbesondere Hörgeschädigte haben jedoch Schwierigkeiten zu verstehen, was gesagt wird, wenn die Zielsprache leise ist. In dieser Studie wurde dies in zwei typischen Alltagssituationen untersucht: Eine mit Sprache aus unterschiedlichen Entfernungen mit Nachhall und ein zweites Szenario mit Sprache aus einem benachbarten Raum. Insgesamt 20 Teilnehmer mit leichtem bis mittelschwerem Hörverlust nahmen an der Studie teil. Gemessen wurden die Sprachverständlichkeit, die Lautheit und die Höranstrengung. Die Hörgeräte wurden mit zwei Programmen angepasst, eines mit einer Funktion, die bei niedrigen Eingangspegeln mit Sprache zusätzliche Verstärkung bietet, und eines ohne diese Funktion. Die Ergebnisse zeigen deutlich, dass diese leisen Sprachsituationen für Hörgeschädigte eine Herausforderung darstellen, selbst mit Hörgeräten. Die zusätzliche Verstärkung bei diesen niedrigen Pegeln führte zu einer signifikanten Verbesserung der gemessenen und wahrgenommenen Sprachverständlichkeit sowie der wahrgenommenen Höranstrengung. Insgesamt unterstreicht diese Studie die Notwendigkeit, leisen Sprachsituationen bei der Versorgung von Hörverlusten mehr Beachtung zukommen zu lassen.
1 Introduction
Communication is central to our daily lives. Effective communication in quiet and noisy environments allows us to connect and build relationships with loved ones, friends, colleagues, study buddies, travel companions, and our entire communities. However, hearing-impaired people find it more difficult to communicate effectively, especially in challenging situations [1], [2].
When discussing hearing difficulties experienced by hearing impaired people in demanding situations, research often focuses on noisy, disturbing situations [3], [4], [5], [6]. However, Wu et al. [7], for example, reported that only less than 20% of all situations in everyday life are ‘noisy’ or ‘very noisy’ (see also Wagener et al. and Smeds et al. [8], [9]). In an earlier study Mueller and colleagues [10] found that only 10% of the logged everyday-life situations were described as noisy.
To assess hearing and hearing-aid benefits in everyday life, we need to consider the other 80%, because “in hearing science, ecological validity refers to the degree to which research findings reflect real-life hearing-related function, activity, or participation”, as stated in the consensus paper by Keidser et al. [11]. Unfortunately, there is not much literature about quiet situations with soft speech.
Banerjee [12] recorded the input levels measured by hearing aids in different daily-life situations at 5-second intervals and reported that about half of the situations had input levels of below 50 dB SPL. These situations included situations with and without target speech. Pearsons et al. [13] reported that casual speech can occur at levels between 50 and 53 dB(A) with a standard deviation of 4 to 5 dB, indicating that speech levels can also be as low as 45 dB(A). These soft situations are important as shown in Marke Trak VII survey [14]. They reported that 22% of the hearing-aid users were dissatisfied with their ability to hear soft sounds. Olsen [15] also mentioned that in classrooms the level of the teacher’s speech can be as low as 57 dB(A) in the back of the classroom and in hospitals the speech levels can be as low as 55 dB(A) at conversational distance. In Banerjee [12], participants rated that 86% of all sounds of interest were in near distance (<10 ft or <3 m) and 14% of situations are in far distance.
In the more recent Marke Trak X [16], hearing aid users and non-users were asked to rate their satisfaction with hearing in different situations. Averaged across all listening situations 79% of hearing aid users were satisfied. However, they were least likely to be satisfied with their ability to hear in a classroom (66%). This is a typical situation where the distance to the speaker and the room characteristics are important factors. Therefore, one aim of this study was to further investigate a reverberant ‘soft speech at distance’ situation.
Two effects are particularly important in rooms: the decrease of signal energy with distance according to the inverse square law, and the influence of room acoustics (reverberation). The sound pressure level of direct sound is reduced by 6 dB when the distance is doubled, while the sound pressure level of diffuse reverberation remains constant [17]. The distance at which the energy of the target signal is equal to the energy of the reverberation is called the ‘critical distance’. Here, the direct-to-reverberant ratio (DRR) is 0 dB [18]. The DRR decreases with increasing distance between the speaker and the listener.
A study by Huang et al. [19] investigated how reverberation and listener-to-speaker distance affect listening effort (LE), both behaviorally (response times) and subjectively. Additionally, they investigated whether LE is affected differently inside and outside the critical distance. The effects were more pronounced when listeners were outside the critical distance, where the DRR is lower. This indicates that a lower DRR, associated with higher reverberation and greater distances, negatively impacts both behavioral and subjective measures of LE. These results are in line with the Framework for Understanding Effortful Listening (FUEL) as described by Pichora-Fuller et al. [20]. In this framework reverberation is one of the “transmission factors” that increase listening demands.
In a study on spatial release from masking, Rennies & Kidd [21] investigated the benefit of binaural listening on LE and speech intelligibility (SI). They showed that SI and LE correlate strongly with each other with regard to spatial release effects. Interestingly, the spatial release of LE disappears with very strong reverberation. Modeling similar data with the binaural speech intelligibility model (BSIM2020, by Hauth et al. [22]) showed very good predictions for LE, which shows that there is no difference between LE and SI for spatial release of masking effects [23].
While, data from Huang et al. [16], Rennies & Kidd [21] and Krueger [23] were collected for speech in noise and for medium speech levels around 65 dB SPL, literature on SI and LE in quiet and soft speech levels remains rare. Therefore, one aim of this study was to investigate both SI and LE in soft and reverberant speech situations.
Another potentially difficult situation with soft speech was mentioned in a questionnaire survey by Pang et al. [24]. They asked 50 adult subjects to rate “difficult listening situations”: 25% of these were related to audibility issues and among these the most commonly reported issues were those associated with distance between speaker and listener. This included the speaker being located in a different room. In the EuroTrak Germany from 2018 [25] the situation “at home with family members” was rated as the situation in which it is most important to hear well. Schulte et al. [26] investigated the importance and frequency of different demanding situations. On a scale from 1 (once a year) to 7 (several times a day) the frequency should be indicated and on a scale from 1 (unimportant) to 7 (extremely important) the importance should be classified. The relevance score was calculated by the sum of both. The second most relevant situation was “Speech from the neighboring room (Ansprache aus Nebenzimmer)“, like the “located in a different room” situation found by Pang et al. [24]. Therefore, the situation with target speech coming from another room is the second situation of interest in this study: “Adjacent room”.
The adjacent room condition is relatively new, and to our knowledge, there is no comparable study. However, obstacles in the sound path, e.g., a door when listening to somebody speaking in an adjacent room, or face masks, affect the spectral shape of the speech signal. Brown et al. [27] showed that face masks reduce SI in noisy conditions but not in quiet. However, the subjective LE increases also in quiet and even more in noisy conditions.
In difficult listening situations hearing-impaired people rely on hearing aids. Amplification and particularly dynamic compression are standard options to help hearing-impaired in any listening situations. In a laboratory setup, Wolfe et al. [28] investigated the effect of amplification for hearing-impaired children for soft speech from the front (0°). The aided intelligibility was clearly worse compared to normal-hearing children, especially at softer levels. At 40 dB(A), the hearing-impaired children had in mean 30% worse speech-recognition scores and at 50 dB they understood nearly 20% less of the words. Wolfe et al. [28] showed that increasing gain for softer input levels reduced the difference from normal hearing performance. For children, fitting rationales were developed that are designed to improve audibility by increasing prescribed amplification for softer input levels. Scollie et al. [29] investigated the performance and individual preferences for the two prescription rules NAL-NL2 and DSL in different real-life situations. The DSL formula provides more gain compared to NAL-NL2 for low input levels. For soft speech in quiet environments, the children preferred DSL prescription. For speech in noise, the children chose the NAL-NL2 prescription.
Stronks et al. [30] investigated speech recognition and listening effort in Cochlear implant users at even lower levels of 25 to 45 dB(A), which corresponds to the sound level of a quiet whisper. They investigated a SoftVoice algorithm that removes the system noise of the CI. Due to the reduction of the system noise, the algorithm was able to reduce listening effort and improve speech intelligibility at these low levels. They also reported that the SRT50 for CI users is at approximately 38 dB SPL in quiet situations.
Pittman & Stewart [31] investigated the effect of different prescription rules (NAL-NL2 and DSL) as well as a low-level adaptive gain feature. The goal of the adaptive gain feature was to increase speech audibility especially at low levels. Speech reception threshold and four suprathreshold auditory tasks, that increased cognitive demand, were investigated. They found that the improved audibility increases word recognition and nonword detection. However, this was investigated in a laboratory setup with speech from 0° and it is not obvious what effect amplification will have in more realistic situations with distant and reverberant speech.
The aim of this study was to investigate the challenges of situations with low-level speech for older hearing-impaired people. In two different typical everyday situations, the effect of additional gain was tested.
2 Method
2.1 Participants
Twenty-one subjects (eight female, thirteen male) with mild to moderate hearing loss participated in the study. The age of the participants ranged from 63 to 83 years with a mean age of 76 years. All subjects were experienced hearing aid users for at least two years. Hearing thresholds, correspondin on average to Bisgaard’s N4standard audiogram [32], are shown in Figure 1 [Fig. 1].
Figure 1: Hearing thresholds of the test subjects (mean and standard deviation). Individual thresholds are shown in grey.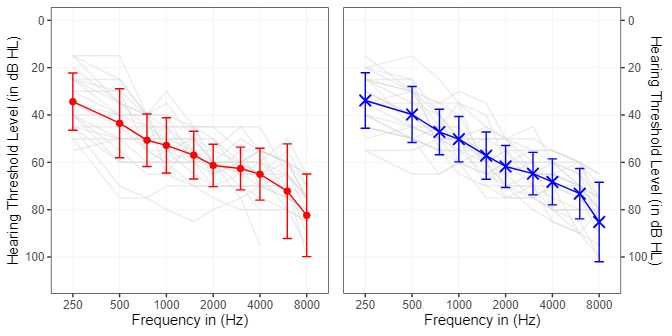
The participants were fitted binaurally with Phonak Audeo P90-R hearing aids connected to SlimTips with closed vents which is comparable to a closed custom fitting. Hearing aid receivers were selected according to the manufacturer recommendations from either M receivers (16 subjects) or P receivers (6 subjects) depending on the individual hearing loss. Gains were set based on the fitting rule APD 2.0 [33] and noise reductions were turned off. Microphone mode was set to a directionality which restores the pinna cues as default for calm situations. Feedback reduction algorithm with individually measured feedback threshold was activated, and frequency lowering was deactivated.
The Adaptive Situational Gain feature (ASG) provides additional amplification for soft speech (cf. Pittman & Stewart [31]) and can be activated in the fitting software (Speech Enhancer feature). In principle, ASG works like an additional AGCi (input related automatic gain control), providing additional gain for input levels between 30 and 50 dB SPL, but only when soft speech is detected in a quiet environment. Therefore, the SNR must be at least 10 dB SNR. In addition to the gain adjustments during finetuning, ASG can provide up to 10 dB additional gain between 500 Hz and 3 kHz. Pittman & Stewert [31] measured 6 dB additional gain between 500 Hz and 3 kHz for an input level of 40 dB SPL. They also showed that the gain is only applied to soft speech, in contrast to a manual finetuning where every signal is amplified in the same way: speech, noise, or speech in noise. Two conditions were tested, “ASG on” with the speech enhancer set to the maximum value of 20, and “ASG off” with the speech enhancer deactivated.
The experiment was approved by the medical ethics committee (2021-172) of the Carl von Ossietzky University in Oldenburg, Germany.
2.2 Setup reverberant room
The reverberant room was the entrance hall of the House of Hearing, Oldenburg, Germany. It has a complex shape (see Figure 2 [Fig. 2]), with an outer length of 15.3 m, an outer width of 7.76 m and a height of 3.01 m. The entrance hall is connected to other floors by stairs. The reverberation time T60 is 0.8 s.
Figure 2: Sketch of the Reverberant room setup, i.e., the foyer of the House of Hearing, Oldenburg, with a T60 reverberation time of 850 ms; participants were seated at the X marked position viewing along the line of loudspeakers at 2 m, 4 m, and 8 m distance; dimensions denoted without physical unit are also in meter. The circle in the middle of the sketch is a pillar made of concrete. 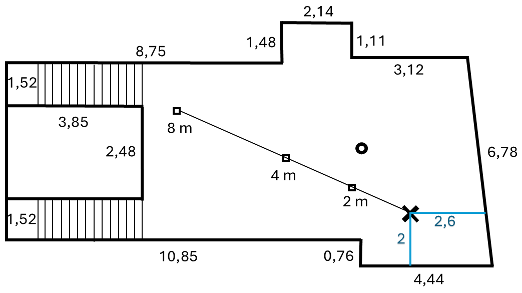
Participants were seated on a chair at one end of the room with a distance of 2 m to the closest walls. Three Genelec 8010 loudspeakers were placed at distances of 2 m, 4 m, and 8 m from the participant seat. Each loudspeaker was calibrated at the distance of 4 m. After calibration loudspeakers were placed at the different positions. Due to the reverberation, presentations of speech stimuli with equal loudspeaker levels resulted in relative sound pressure levels at the listening position of 1.8 dB (loudspeaker distance 2 m), 0 dB (loudspeaker distance 4 m), and 0.4 dB (loudspeaker distance 8 m). The DRRs for these source positions are –2.9 dB, –7.9 dB, and –15.2 dB, respectively (measured using the method of Mijic and Mašovic [34]). All the measurements are made beyond the critical distance of 1.4 m. Measurements were carried out in the late afternoon or at the weekend to ensure low background noise conditions, below 30 dB(A).
Figure 3 [Fig. 3] shows spectra of direct and diffuse reverberation components, which were determined by convolution of speech-shaped noise (corresponding noise of the used speech corpus) with the direct sound part (signal part before first reflection) and the late reverberation part (signal part after early reflections) of measured impulse responses for these loudspeakers (impulse responses were measured according to Farina [35]).
Figure 3: Power density spectra (1/3 octave) for speech-shaped noise convolved with impulse responses for the three distances of 2 m, 4 m, and 8 m; solid lines show the spectra using only the direct sound component of the impulse responses, dashed lines show spectra for the diffuse reverberation component.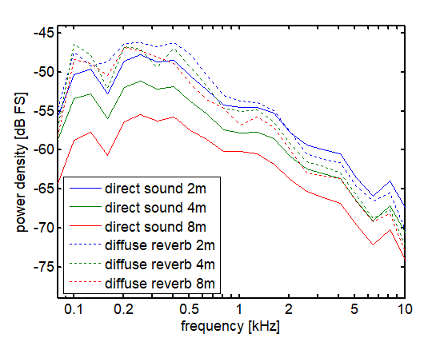
Tests were implemented in Matlab and run on a Windows tablet computer (Surface Go), which was connected to the loudspeakers via a Focusrite Scarlett 4i4 sound interface. The tablet computer was either handled by the experimenter (SRT50 measurements) or placed in front of the participants, so that they could respond via the touch screen.
2.3 Adjacent room
The adjacent room scenario was realized in the seminar room of the House of Hearing, Oldenburg, Germany. Participants sat in the seminar room with a reverberation time T60 of 0.4 s at a distance of 3 m from the door (see Figure 4 [Fig. 4]). A Genelec 8010 loudspeaker was placed in the corridor in front of the seminar room facing the door at 1 m distance. Devices and speech test implementation were the same as for the reverberant room. The door was open a gap of approx. 10 cm. The DRR for this setup is –5.2 dB (measured using the method of Mijic and Mašovic [34]). Measurements were also carried out in the late afternoon or at the weekend to ensure background levels of below 30 dB(A). Figure 5 [Fig. 5] illustrates the effect of speaking through a door by comparing the power spectral density of the speech signals recorded in the same room or through a door from an adjacent room (both at a distance of 4 m). Above 1.5 kHz, the door has the same effect as a low-pass filter reducing the power by about 3 to 5 dB.
Figure 4: Sketch of the adjacent room setup; participants were seated viewing towards the slightly open door, behind which speech was presented; dimensions denoted without physical unit are in meter.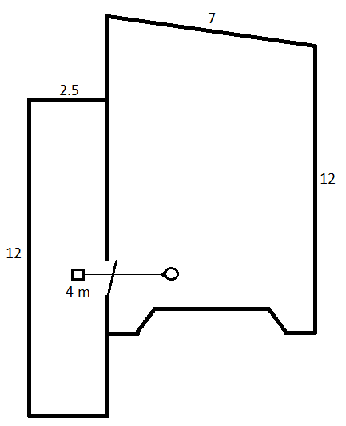
Figure 5: Power density spectra (1/3 octave) for speech-shaped noise convolved with impulse responses for the adjacent room setup vs. with the loudspeaker placed in the same room as the microphone (both at 4 m distance), which is placed at the listening position.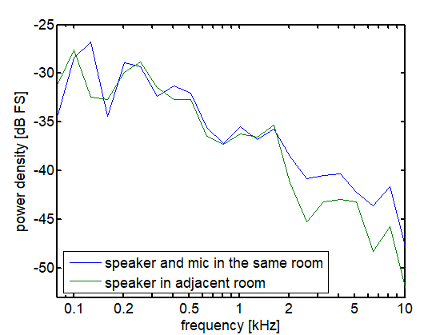
2.4 Procedure
Data were collected during two test sessions.
Session 1: Adjacent Room
First, SRT50s were measured in the adjacent room setup. For training, one lists of 20 sentences was performed. A third list was measured that served to determine the SRT50 in Decibel for the condition ASG off. For the conditions ASG on and ASG off, two more measurements with a fixed level of individual SRT50+7 dB were performed. Next, the subjective ratings were performed for loudspeaker presentation.
Session 2: Reverberant Room
The reverberant room session started with the determination of SRT50 levels and fixed-level speech-tests (two trainings, SRT50, and fixed for ASG off/on). Second, the listening effort scaling was conducted for ASG off/on. Finally, a subjective assessment was performed for ASG off/off versus all loudspeaker positions.
The order of the ASG conditions and the order of loudspeaker positions were randomized for all the tests. Test order was defined by a block randomization with a size of 2 corresponding to the possible test orders.
2.5 Measures
SRT50s in quiet were measured using the Oldenburg Sentence Test (German: OLdenburger SAtztest, OLSA; [36]). A Matlab implementation of the adaptive procedure A1 from Brand and Kollmeier [37] was used to determine thresholds with 50 percent correct responses. To avoid training effects, one trial list was measured before the test list of twenty sentences. Presentation levels were calibrated in dB(A) using the corresponding speech-shaped noise of the OLSA talker.
Fixed level speech recognition was measured to assess the effect of ASG. Therefore, a test list of the OLSA was presented at the individual SRT50%. The outcome measure is the percentage of correct repeated words.
Listening effort scaling was performed as a function of distance. Therefore, a Matlab implementation of the adaptive ACALES [38] was modified to a static version so that the three distances were tested instead of different SNRs. The presentation level was individually set to SRT50+7 dB at a distance of 4 m. This ensures a good comprehension for the individual subjects. Per trial, three OLSA sentences were presented. Each distance was tested three times per measurement. Participants performed a training before testing the conditions ASG off and ASG on. The scale ranged from 1=“no effort” to 13=“extreme effort”.
Subjective ratings were taken for speech perception and ease of understanding. Paper sheets with scales from 1–100 for each category were handed out to the participants. Scales were labeled:
For speech understanding (SU): “Ich verstehe die Sprache: sehr schlecht (0)… sehr gut (100)” (English: “I understand the speech: very poorly (0)… very well (100)”).
For ease of understanding (EU): “Das Verstehen der Sprache ist für mich: sehr schwierig (0)… sehr einfach (100)“ (English: “Understanding the speech is for me: very difficult (0)… very easy (100)”).
For loudness: “Die Lautstärke der Sprache ist für mich: unhörbar (0) … zu laut (100)” (English: “The loudness of speech for me is: inaudible (0)… too loud (100)”).
Ratings were performed for playback sentences. The playback sentences from the Oldenburg Sentence test corpus (OLSA sentences) were presented from the loudspeakers at individual presentation levels of SRT50+7 dB in the adjacent room. In the reverberant room the SRT50+7 dB from 4 m was used and kept constant for 2 m and 8 m as if the loudspeaker was moved to the other distances. This simulates a situation in which a person speaks with the same loudness but at different positions. For each rating, sentences were presented continuously until a paper sheet was finished.
2.6 Statistical analysis
Data analysis was performed with linear mixed effect models where the outcome measures were explained by the DRR, the pure-tone average, and the age as fixed effects for the analysis of aided data with ASG off and by DRR for the effect of ASG (difference between ASG on and off). Subject identification was assigned as random effect as the measurements were repeated for every test condition and distance. The distribution of the residuals was evaluated visually to be normally and independently distributed. Analyses were conducted in R. The lme4 package [39] was used to fit the model and the afex package [40] to test the effect of the fixed terms with likelihood ratio tests.
3 Results
3.1 Part 1: ASG effect (reverberant room setup)
Figure 6 [Fig. 6] shows the effect of the adaptive situational gain (ASG) feature on OLSA speech signals at about 45 dB(A). Sentences were recorded with hearing aids on a KEMAR dummy head. Looking at the 65th percentiles, levels increase from ASG off (in brown) to ASG on (in lavender) by about 4 dB for all talker positions.
Figure 6: This figure shows the effects of the ASG feature on the dynamic range of OLSA speech; 30th, 65th and 99th percentiles are shown for the condition ASG off (left) and ASG on (right) for the different talker positions. The light shaded area is the 30%–65% range and the dark shaded area is the 65%–99% range. Speech is played back at 46.8, 45.0, and 45.4 dB (A) for the 2, 4, and 8 m conditions, respectively.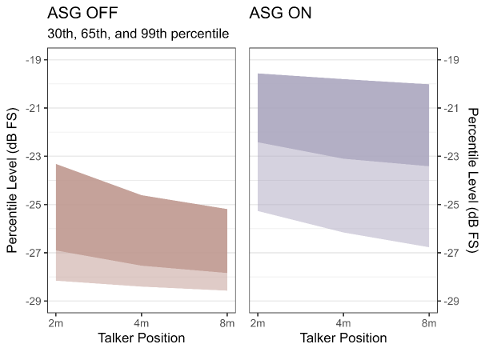
3.2 Part 2: Speech intelligibility
The mean SRT50 over all subjects at 4 m distance in the reverberant room was 42.1 dB (SD=5.9) (Figure 7 [Fig. 7]). The SRT50 ranged from 33 dB SPL to 53.5 dB(A). The mean SRT50 in the adjacent room was 39.7 dB (SD=6.1) with a range from 30 dB SPL to 53 dB(A).
Figure 7: Distribution of speech intelligibility scores, measured with the German matrix test (OLSA) with a talker distance of 4 m for the reverberant room and talker placed in the adjacent room (left). Within subject effect of ASG on speech intelligibility are shown on the right. Improved performance with ASG corresponds to positive values.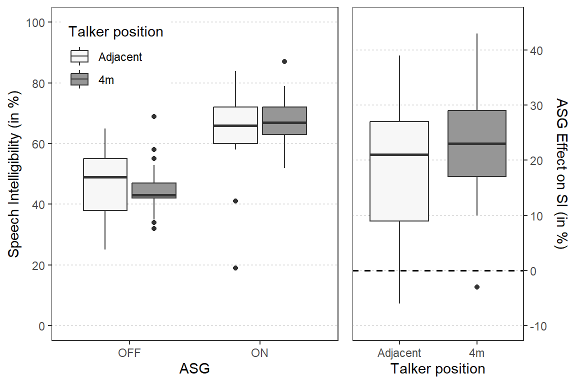
The individual SRT50 levels were used to determine the speech levels for the measurements at fixed levels. Before the analysis, these scores were transformed into rationalized arcsine units (rau) to compensate for the non-linear characteristic of intelligibility functions in the floor and ceiling regions [41]. The results are expressed in percent points for a better understanding of the differences between test conditions. The significance level was adjusted to 0.025 due to repeated testing in both conditions. A significant improvement of SI was observed with ASG on (67.7%, SD=8.8 %) over ASG off (44.8%, SD=8.7%) for the reverberant room (t(20)=9.9, p<0.001). For the adjacent room, results also show an improvement of SI with ASG on (64.8%, SD=14.1 %) over ASG off (46.5%, SD=11.6%) (t(20)=7.1, p<0.001).
3.3 Part 3: Subjective ratings
The distribution of the subjective ratings on the three subscales with the condition ASG off is shown in Figure 8 [Fig. 8]. The DRR was measured for each talker position and arranged in decreasing order on the x-axis, so that the most favorable listening condition is shown on the left and the most difficult condition on the right.
Figure 8: The figure shows the results for the rating of speech understanding (left), ease of understanding (middle) and loudness of the talker (right)in the condition ASG off. The talker position is shown in the x axis ordered in decreasing DRR value (–2.9 dB at 2 m, –5.2 dB for the adjacent room, –7.9 dB at 4 m, and –15.2 dB at 8 m). 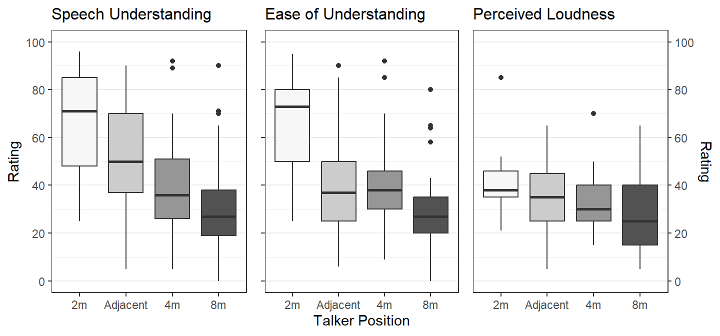
The effect of DRR on the subjective rating was evaluated with a linear-mixed effect on the three subscales. The significance level was adjusted to 0.017 for repeated testing over the subscales. The estimated parameters with their 95% confidence interval are listed in Table 1 [Tab. 1].
Table 1: Summary of the fixed effects estimates and their 95% confidence interval from the linear mixed-effect model for speech understanding (SU), ease of understanding (EU), and perceived loudness as dependent variable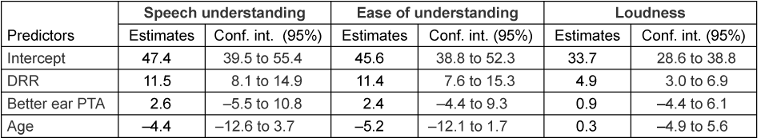
More difficult listening conditions with lower DRRs were significantly associated with lower rating of SU (χ2 (1)=34.3, p<0.001), lower ratings of EU (χ2 (1)=27.8, p<0.001), and lower ratings of perceived loudness (χ2 (1)=21.3, p<0.001). Four-frequency pure-tone average hearing losses for the frequencies of 500 Hz, 1 kHz, 2 kHz and 4 kHz (PTA) of the better ear and age did not significantly contribute to the subjective ratings on any subscale.
The ASG effect, the difference between ASG on and ASG off, was computed by subscale, subject and talker position so that positive values indicate a benefit with ASG. The distribution of the ASG effect is shown by subscale and talker position ordered in decreasing DRR in Figure 9 [Fig. 9].
Figure 9: Effect of ASG on ratings of speech understanding (left), ease of understanding (middle) and loudness of the talker (right) for the different distances and rooms. The order at the x-axis is according to the DRR values which range from –2.9 dB at 2 m, –5.2 dB for the adjacent room, –7.9 dB at 4 m, to –15.2 dB at 8 m. 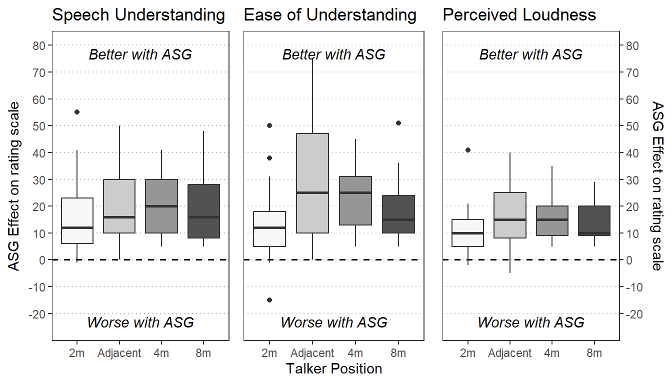
The ASG effect was computed for each subscale with adjusted significance level to 0.017 for multiple testing. The centered and scaled DRR was added as fixed effect, and the intercept is estimating the ASG effect for a mean DRR of –7.8 dB (which is close to the 4 m distance in a reverberant room). The tested subject was included in the model as random effect to represent the dependency between the observations.
The ASG effect is significant for all subscales, including speech understanding (mean change=19.8, standard error=2.0, t(21)=10.1, p<0.001), ease of understanding (mean change=21.1, standard error=2.0, t (21)=10.4, p<0.001), and perceived loudness (mean change=14.4, standard error=1.4, t (21)=10.1, p<0.001).
The effect of DRR was not significant on speech understanding (estimate=–0.46, standard error=1.26, t(63)=–0.37, p=0.72), ease of understanding (estimate=0.26, standard error=1.75, t (63)=0.15, p=0.88), and perceived loudness (estimate=–0.37, standard error=0.94, t (63)=–0.39, p=0.70) indicating that the ASG effect is similar for all DRRs.
3.4 Part 4: Listening effort scaling
The results of the listening effort (LE) scaling using the ACALES test are shown in Figure 10 [Fig. 10] by distance where high ESCUs stand for higher listening effort. Listening effort scores are expressed in effort scaling categorical units (ESCU).
Figure 10: Here the ACALES data are shown over distance in the reverberant room for the condition ASG off. The ESCU values range from 1=“no effort” to 13=“extreme effort”.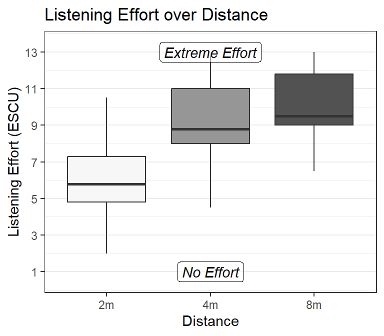
The average listening effort increases with distance from 6.3 ESCU (SD=2.5) at 2 m to 9.0 ESCU (SD=2.2) at 4 m and finally to 10.1 ESCU (SD=2.0) at 8 m. Pure-tone average and age were included in the model as covariates as they might provide additional information about the distribution of the results. Changes in listening effort were modelled by the speaker’s distance, the age and the better ear PTA using a linear mixed-effect regression (Table 2 [Tab. 2]).
Table 2: Summary of the fixed effects estimates and their 95% confidence interval from the linear mixed-effect model on the listening effort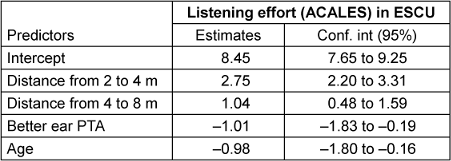
Collinearity was also verified with the variation inflation factor (vif) as age and pure-tone average might not be independent predictors. All the fixed effects could be kept in the model as the vif remains low (distance=1.0, age=1.03, PTA=1.03). Significance of the fixed effect were tested with likelihood ratio test which indicates that listening effort significantly increases with higher distance (χ2 (2)=75.0, p<0.001), significantly decreases with higher PTA (χ2 (1)=6.1, p=0.013), and significantly decreases with age (χ2 (1)=5.8, p=0.016).
The distribution of the ASG effect (difference between ASG On and Off) is shown by tested distance in Figure 11 [Fig. 11]. The median ASG effect is about –2.8 ESCU at 2 m, –2.0 ESCU at 4 m, and –2.5 ESCU at 8 m.
Figure 11: Effect of ASG on LE ratings in the reverberant room over distance. Negative values are plotted upwards as they indicate a positive effect on LE, which is a reduction in LE. 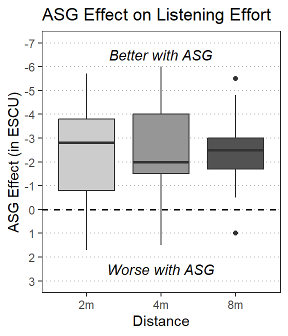
The ASG effect on listening effort was analyzed with a linear mixed effect regression where the intercept of the model is the average ASG effect and the distance, entered as fixed effect with successive differences contrast coding i.e., the first coefficient estimates the change from 2 m to 4 m and the second coefficient estimates the change from 4 m to 8 m. The degree of freedom estimation to calculate p-values used Satterthwaites’s method, which allowed us to test if the intercept (the ASG effect) is different from zero.
The average ASG effect (–2.4 ESCU) is significant (p<0.001 and 95% confidence interval=–3.0 to –1.7 ESCU). Increasing the distance of the talker does not affect the ASG effect i.e., a change of –0.06 ESCU (95% confidence interval=–0.9 to 0.8 ESCU) from 2 m to 4 m and a change of –0.01 ESCU from 4 m to 8 m (95% confidence interval=–0.8 to 0.8 ESCU).
4 Discussion
This study investigated speech intelligibility (SI) and listening effort (LE) for hearing-impaired people in soft-speech situations with levels below 55 dB(A), and the effect of additional situational gain (ASG) in these situations. To cover the most relevant soft-speech situations, we chose one reverberant situation where the speaker is at different distances and a situation with a speaker talking through an open door from a neighboring room. Accordingly, the goal of this paper was to investigate the factors reverberation, high frequency damping, and how additional gain would help the hearing-impaired people in terms of LE, SI and loudness.
The reverberant and the adjacent room scenario
In the reverberant situation, the DRR decreased with distance from the loudspeaker from –2.9 dB at 2 m over –7.9 dB at 4 m to –15.2 dB at 8 m. The decrease in DRR with distance is particularly noticeable at low frequencies, where the reverberant signal has a higher sound pressure level than the direct signal from the loudspeaker (see Figure 3 [Fig. 3]). The difference in power between the direct and reverberant signal components is much less for higher frequencies above 1 kHz.
In the adjacent-room scenario, the DRR is –5.2 dB. With a T60 of 0.8 s (reverberant scenario) and 0.4 s (adjacent room), the reverberation is not very high, but still relevant as evidenced by the DRR values, which are all negative.
Figure 5 [Fig. 5] demonstrates the additional low-pass-filter effect of a slightly open door on the signal in the neighboring room situation. For frequencies below 1.5 kHz there is no difference. However, above 1.5 kHz the energy is up to 5 dB lower compared to a situation without a door. This shows how different the effects of room acoustics are in these two situations. The DRR for the neighboring room was estimated as DRR=–5.2, which is between the DRRs for 2 m and 4 m in the reverberant room setup.
The ratings of speech understanding (SU), ease of understanding (EU) and loudness were made at individual SRT50 +7 dB. It can be assumed that at 7 dB above the 50% threshold the intelligibility is at ceiling. The corresponding mean presentation levels in both rooms were 49 and 47 dB(A) and are comparable to the levels of casual speech as shown by Pearsons et al. [13]. This indicates that a realistic level was used. To compare the subjective ratings between both rooms (Figure 8 [Fig. 8]), results for the adjacent room and for the three distances in the reverberant room are plotted together as a function of the DRR. As the DRR decreases, the SU, EU and loudness ratings decrease, which clearly shows that DRR is an important factor.
Speech intelligibility
The SRT50s for the two room conditions amount 42.1 dB(A) (reverberant room at 4 m distance) and 39.7 dB(A) (adjacent room). Stronks et al. [30] investigated speech recognition and listening effort in Cochlear implant users and observed slightly lower SRT50s (38 dB(A) median). In their study, they investigated speech in quiet without any reverberation.
SU ratings clearly showed that intelligibility deteriorated with distance. In addition, comparing both scenarios, a clear dependency of the DRR on subjective SU is evident. Similarly, Rennies and Kidd [21] compared two scenarios with a DRR=–7 (high-DRR) and a DRR=–17 (low-DRR). They showed that the low-DRR scenario led to significantly lower SRT50 values, i.e., up to 5 dB higher SNR values.
To investigate the effect of the ASG, SI was measured at fixed levels, corresponding to the individual SRT50 +7 dB. With ASG switched on, there was a significant improvement in intelligibility of about 23% in the reverberant room and about 18% in the adjacent room. This is consistent with the additional gain of approximately 4 dB provided by the ASG feature, as shown in Figure 6 [Fig. 6], for presentation levels of approximately 45 dB(A). Although the variability in benefit is high, 20 out of 21 participants showed an improvement in SI indicating a high success rate. A positive effect of additional gain was also shown by Scollie et al. [29] in a study on real-world preferences of hearing-impaired children aged 6 to 19, Pittmann and Stewart [31] in a study with speech tests at 40 and 70 dB SPL presentation level with children aged 9 to 17, and Stronks et al. [30] in a study with eighteen adult CI-user and presentation levels between 25 and 45 dB(A). They all also investigated speech intelligibility at low levels. Scollie et al. [29] as well as Pittmann and Stewart [31] compared the two prescription rules NAL-NL1 and DSL v.4.1 and NAL_NL2 versus DSL v5.0a where DSL was expected to allow higher gain than NAL [42]. Scollie et al. [29] showed that children preferred the DSL rule especially for real world scenarios with lower levels and Pittmann and Stewart [31] showed significantly better SRT50s in quiet and better word recognition in quiet at a level of 40 dB SPL with DSL. Pittmann and Stewart also investigated the effect of ASG and were able to show that the word recognition in quiet increased significantly. The current study extends the results of better intelligibility with additional gain for the patient group of adults with mild to moderate hearing losses.
Loudness
The effect of distance on perceived loudness was not as strong as on LE and EU. This was somewhat expected as level of the reverberant part of the sounds does not decrease further with distance. At distances beyond the critical distance (DRR<0 dB), this means that the overall loudness does not change substantially with distance. On the other hand, the effect of the ASG was very clear and led to an expected increase in perceived loudness on average between 10 and 20 scale points.
Ease of understanding/listening effort
As the target speech levels were individually set to SRT50 +7 dB, it can be assumed that the participants were able to understand everything. However, as the distance increased, the median EU scores for these soft-speech situations dropped from over 70 scale points (at 2 m) to below 40 scale points (at 4 m, 8 m and in an adjacent room). This clearly indicates how challenging these situations are for hearing aid users (Figure 8 [Fig. 8]). The adjacent room led to similar EU rating as the reverberant room at 4 m, although the DRR is 3 dB higher. This can be explained by the low-pass effect of the slightly open door, which decreased high frequencies by 3–5 dB. Comparable effects were observed during the Covid-19 pandemic with face masks, which had a low pass filter effect on speech. Brown et al. [27] showed that face masks reduce speech intelligibility in noisy conditions but not in quiet. However, the subjective LE also increases in quiet and even more in noisy conditions compared to a situation without masks.
In the original ACALES version as described by Krüger et al. [38], the speech level and thus the SNR is varied while the noise level remains constant. Using these SNR variations, ACALES adaptively scans the rating scale based on a subject’s responses. In this study a modified ACALES approach was used in which not the SNR was varied, but the distance to the speaker. Thus, subjects had to rate the LE for different distances to the speaker in a randomized order. For the condition ASG off, Figure 10 [Fig. 10] shows that LE increases significantly with increasing distance. Particularly, the mean listening effort increases with distance from 2 m to 8 m from about 5.8 to about 9.5 on a 13-point scale which is an increase of about 4 scale points. In a study by Winneke et al. [43] the benefit of a new noise reduction system was investigated with a static version of ACALES. The noise reduction, a directional microphone technology, reduces the perceived LE by about two scale units. This correlated with a decrease in brain activity measured with EEG in a 9–12 Hz band. In this study, the LE decrease by 2 to 3 scale units due to the ASG feature, and, it can be assumed that the reduced LE in this study is also associated with physiological correlates.
The effect of distance, as measured with the adapted ACALES, supports the subjective ratings of the assessment of EU (see Figure 9 [Fig. 9]). With increasing distance, the LE increases and the EU is decreasing. Huang et al. [16] showed that the effects of reverberation were larger outside the critical distance (DRR<0 dB) than inside (DRR>0 dB). This finding is also consistent with the LE study by Rennies & Kidd [21].
Listening effort, as measured by the adapted ACALES, decreases significantly with age. Similar but non-significant effects were also found by Krüger et al. [23]. Larsby et al. [44] measured perceived listening effort in young and older normal hearing listeners and also found similar results. They suggested that older adults tend to rate perceived listening effort lower than younger adults. However, also differences in intelligibility (although not found to be significant here) and cognition could also influence the results.
The effect of the ASG as shown in Figure 9 [Fig. 9], i.e., the increase in gain, was comparable for all three dimensions: SU, EU, and loudness for both scenarios. It is assumed that the ASG feature not only increased the gain of the speech signal but also the gain of the reverberation. Still, subjects experienced benefits of about 10 to 20% points in all dimensions. The extra gain may have improved the audibility especially for the soft parts in the speech signal. This might help to capture glimpses of speech exceeding the reverberation level.
5 Conclusion
The perception of soft speech in quiet was tested for two real rooms: a larger room with reverberation, where distance and reverberation are important parameters, and a combination of two rooms, where listening to speech from an adjacent room was simulated. Overall, the results of subjective ratings (EU, SU and loudness), speech tests, and ACALES fit together well and give a coherent picture. An anti-proportional effect of DRR on LE was observed, and consequently, a proportional effect on subjective EU. Therefore, we suggest that it is important to consider the DRR as an important factor for experimental designs. However, further research is needed to compare the effects of reverberation and DRR on SI, EU and loudness.
The benefit of ASG was evident in all measures (speech intelligibility and subjective ratings). We can conclude that this feature is particularly beneficial for moderately hearing-impaired adults in relevant soft speech situations. Especially in ACALES, an LE improvement of around 2.5 ESCU was observed for the various distances, which is huge, e.g., compared to the benefit of directional microphones [43]. It can be considered as clinically relevant.
The effects observed in this study with Phonak instruments may not generalize to other instruments and features from other manufacturers. Results may also vary depending on, for example, compression characteristics, fitting strategy etc. As we did not investigated the effect of soft noise without speech in this study, we cannot conclude that more gain is generally beneficial at low input levels. Further research is needed to better understand the effect of more gain by comparing, for example, the ASG feature with a manual adjustment of gain, also in daily life.
Overall, the results show that soft speech is indeed a challenging situation for hearing impaired people, even when using hearing aids. The topic of soft speech is therefore very relevant, especially as such situations occur frequently and should be given more attention.
Abbreviations
- ACALES: Adaptive CAtegorical Listening Effort Scaling
- ASG: Adaptive Situational Gain
- ESCU: Effort Scale Categorical Units
- EU: Ease of Understanding
- LE: Listening Effort
- PTA: Pure Tone Average
- SI: Speech Intelligibility
- SE: Speech Enhancer
- SU: Speech Understanding
- SRT50: Speech Reception Threshold for 50% intelligibility
- Vif: Variation inflation factor
Notes
Author’s ORCID
- Dr. Michael Schulte: 0000-0003-3478-7385
Acknowledgement
We would like to thank Müge Kaya and Anja Kreuteler for taking measurements late in the afternoon and even on Saturdays.
Funding
This work was funded by Sonova and the Deutsche Forschungsgemeinschaft (DFG, German Research Foundation) – Project-ID 352015383 – SFB 1330 C4.
Competing interests
The authors declare that they have no competing interests.
References
[1] Kramer SE, Kapteyn TS, Houtgast T. Occupational performance: comparing normally-hearing and hearing-impaired employees using the Amsterdam Checklist for Hearing and Work. Int J Audiol. 2006 Sep;45(9):503-12. DOI: 10.1080/14992020600754583[2] Dillon H. Hearing Aids. 2nd ed. New York, Stuttgart: Thieme; 2012.
[3] Olsen W. The effects of noise and reverberation on speech intelligibility. In: Bess FH, Freeman BA, Sinclair JS, editors. Amplification in Education. Washington, DC: Alexander Graham Bell Association for the Deaf; 1981. p. 151-63
[4] Payton KL, Uchanski RM, Braida LD. Intelligibility of conversational and clear speech in noise and reverberation for listeners with normal and impaired hearing. J Acoust Soc Am. 1994 Mar;95(3):1581-92. DOI: 10.1121/1.408545
[5] Kirk KI, Pisoni DB, Miyamoto RC. Effects of stimulus variability on speech perception in listeners with hearing impairment. J Speech Lang Hear Res. 1997 Dec;40(6):1395-405. DOI: 10.1044/jslhr.4006.1395
[6] Brungart DS. Informational and energetic masking effects in the perception of two simultaneous talkers. J Acoust Soc Am. 2001 Mar;109(3):1101-9. DOI: 10.1121/1.1345696
[7] Wu YH, Stangl E, Chipara O, Hasan SS, Welhaven A, Oleson J. Characteristics of Real-World Signal to Noise Ratios and Speech Listening Situations of Older Adults With Mild to Moderate Hearing Loss. Ear Hear. 2018 Mar/Apr;39(2):293-304. DOI: 10.1097/AUD.0000000000000486
[8] Wagener KC, Hansen M, Ludvigsen C. Recording and classification of the acoustic environment of hearing aid users. J Am Acad Audiol. 2008 Apr;19(4):348-70. DOI: 10.3766/jaaa.19.4.7
[9] Smeds K, Wolters F, Rung M. Estimation of Signal-to-Noise Ratios in Realistic Sound Scenarios. J Am Acad Audiol. 2015 Feb;26(2):183-96. DOI: 10.3766/jaaa.26.2.7
[10] Mueller M, Kiessling J, Nelson. Asymmetrische Anpassung mit unterschiedlicher Mikrofoncharakteristik rechts und links. Proceedings of 11th annual conference DGA 2008. 2008.
[11] Keidser G, Naylor G, Brungart DS, Caduff A, Campos J, Carlile S, Carpenter MG, Grimm G, Hohmann V, Holube I, Launer S, Lunner T, Mehra R, Rapport F, Slaney M, Smeds K. The Quest for Ecological Validity in Hearing Science: What It Is, Why It Matters, and How to Advance It. Ear Hear. 2020 Nov/Dec;41(Suppl 1):5S-19S. DOI: 10.1097/AUD.0000000000000944
[12] Banerjee S. Hearing aids in the real world: use of multimemory and volume controls. J Am Acad Audiol. 2011 Jun;22(6):359-74. DOI: 10.3766/jaaa.22.6.5
[13] Pearsons KS, Bennett RL, Fidell S. Speech levels in various noise environments (Report No. EPA-600/1-77-025). Washington, DC: U.S. Environmental Protection Agency; 1977.
[14] Kochkin S. MarkeTrak VII: Customer satisfaction with hearing instruments in the digital age. The Hearing Journal. 2005;58(9):30,32-34,38-40,42-43. DOI: 10.1097/01.hj.0000286545.33961.e7
[15] Olsen WO. Average Speech Levels and Spectra in Various Speaking/Listening Conditions: A Summary of the Pearson, Bennett, & Fidell (1977) Report. Am J Audiol. 1998 Oct 1;7(2):21-5. DOI: 10.1044/1059-0889(1998/012)
[16] Picou EM. MarkeTrak 10 (MT10) Survey Results Demonstrate High Satisfaction with and Benefits from Hearing Aids. Semin Hear. 2020 Feb;41(1):21-36. DOI: 10.1055/s-0040-1701243
[17] Ricketts TA, Hornsby BW. Distance and reverberation effects on directional benefit. Ear Hear. 2003 Dec;24(6):472-84. DOI: 10.1097/01.AUD.0000100202.00312.02
[18] Grimm G, Heeren J, Hohmann V. Comparison of distance perception in simulated and real rooms. In: Proceedings of the ICSA 2015, 3rd International Conference on Spatial Audio; 2015 Sep 18-20; Graz. Bergisch-Gladbach: Verband Deutscher Tonmeister (VDT); 2015. p. 20.
[19] Huang H, Ricketts TA, Hornsby BWY, Picou EM. Effects of Critical Distance and Reverberation on Listening Effort in Adults. J Speech Lang Hear Res. 2022 Dec 12;65(12):4837-51. DOI: 10.1044/2022_JSLHR-22-00109
[20] Pichora-Fuller MK, Kramer SE, Eckert MA, Edwards B, Hornsby BW, Humes LE, Lemke U, Lunner T, Matthen M, Mackersie CL, Naylor G, Phillips NA, Richter M, Rudner M, Sommers MS, Tremblay KL, Wingfield A. Hearing Impairment and Cognitive Energy: The Framework for Understanding Effortful Listening (FUEL). Ear Hear. 2016 Jul-Aug;37 Suppl 1:5S-27S. DOI: 10.1097/AUD.0000000000000312
[21] Rennies J, Kidd G Jr. Benefit of binaural listening as revealed by speech intelligibility and listening effort. J Acoust Soc Am. 2018 Oct;144(4):2147. DOI: 10.1121/1.5057114
[22] Hauth CF, Berning SC, Kollmeier B, Brand T. Modeling Binaural Unmasking of Speech Using a Blind Binaural Processing Stage. Trends Hear. 2020 Jan-Dec;24:2331216520975630. DOI: 10.1177/2331216520975630
[23] Krueger M, Schulte M, Brand T. Assessing and Modeling Spatial Release From Listening Effort in Listeners With Normal Hearing: Reference Ranges and Effects of Noise Direction and Age. Trends Hear. 2022 Jan-Dec;26:23312165221129407. DOI: 10.1177/23312165221129407
[24] Pang J, Beach EF, Gilliver M, Yeend I. Adults who report difficulty hearing speech in noise: an exploration of experiences, impacts and coping strategies. Int J Audiol. 2019 Dec;58(12):851-60. DOI: 10.1080/14992027.2019.1670363
[25] EHIMA. EuroTrak Germany 2018. 2018 [accessed 2019 Jan 31]. Available from: https://www.ehima.com/wp-content/uploads/2018/06/EuroTrak_2018_GERMANY.pdf
[26] Schulte M, Vormann M, Meis M, Wagener K, Kollmeier B. Vergleich der Höranstrengung im Alltag und im Labor. 16. Jahrestagung der Deutschen Gesellschaft für Audiologie; 2013 Feb 27 - Mar 02; Rostock.
[27] Brown VA, Van Engen KJ, Peelle JE. Face mask type affects audiovisual speech intelligibility and subjective listening effort in young and older adults. Cogn Res Princ Implic. 2021 Jul 18;6(1):49. DOI: 10.1186/s41235-021-00314-0
[28] Wolfe J, Duke M, Miller S, Schafer E, Jones C, Rakita L, Dunn A, Battles J, Neumann S, Manning J. Low-Level Speech Recognition of Children with Hearing Aids. J Am Acad Audiol. 2022 Apr;33(4):196-205. DOI: 10.1055/a-1692-9670
[29] Scollie S, Ching TY, Seewald R, Dillon H, Britton L, Steinberg J, Corcoran J. Evaluation of the NAL-NL1 and DSL v4.1 prescriptions for children: Preference in real world use. Int J Audiol. 2010 Jan;49 Suppl 1:S49-63. DOI: 10.3109/14992020903148038
[30] Stronks HC, Apperloo E, Koning R, Briaire JJ, Frijns JHM. SoftVoice Improves Speech Recognition and Reduces Listening Effort in Cochlear Implant Users. Ear Hear. 2021 Mar/Apr;42(2):381-92. DOI: 10.1097/AUD.0000000000000928
[31] Pittman AL, Stewart EC. Task-Dependent Effects of Signal Audibility for Processing Speech: Comparing Performance With NAL-NL2 and DSL v5 Hearing Aid Prescriptions at Threshold and at Suprathreshold Levels in 9- to 17-Year-Olds With Hearing Loss. Trends Hear. 2023 Jan-Dec;27:23312165231177509. DOI: 10.1177/23312165231177509
[32] Bisgaard N, Vlaming MS, Dahlquist M. Standard audiograms for the IEC 60118-15 measurement procedure. Trends Amplif. 2010 Jun;14(2):113-20. DOI: 10.1177/1084713810379609
[33] Woodward J, Jansen S, Kühnel V. Hearing inspired by nature: the new APD 2.0 fitting formula with adaptive compression by Phonak. Phonak Insight; 2018 [accessed 2024 Oct 25]. Available from: https://www.phonakpro.com/evidence
[34] Mijić M, Mašović D. Reverberation Radius in Real Rooms. Telfor Journal. 2010;2(2):86-91.
[35] Farina A. Simultaneous measurement of impulse response and distortion with a swept-sine technique. Audio Engineering Society Convention 108; 2000 Feb 21-22; Paris, France.
[36] Wagener KC, Brand T, Kollmeier B. Development and evaluation of a German sentence test III: Evaluation of the Oldenburg Sentence Test. Zeitschrift für Audiologie. 1999;38(3):86-95.
[37] Brand T, Kollmeier B. Efficient adaptive procedures for threshold and concurrent slope estimates for psychophysics and speech intelligibility tests. J Acoust Soc Am. 2002 Jun;111(6):2801-10. DOI: 10.1121/1.1479152
[38] Krueger M, Schulte M, Brand T, Holube I. Development of an adaptive scaling method for subjective listening effort. J Acoust Soc Am. 2017 Jun;141(6):4680. DOI: 10.1121/1.4986938
[39] Bates D, Mächler M, Bolker B, Walker S. Fitting Linear Mixed-Effects Models Using lme4. Journal of Statistical Software. 2015;67(1):1-48. DOI: 10.18637/jss.v067.i01
[40] Singmann H, Bolker B, Westfall J, Aust F, Ben-Shachar MS. afex: Analysis of Factorial Experiments [R package]. 2018. Available from: https://cran.r-project.org/package=afex
[41] Sherbecoe RL, Studebaker GA. Supplementary formulas and tables for calculating and interconverting speech recognition scores in transformed arcsine units. Int J Audiol. 2004 Sep;43(8):442-8. DOI: 10.1080/14992020400050056
[42] Ching TY, Scollie SD, Dillon H, Seewald R, Britton L, Steinberg J. Prescribed real-ear and achieved real-life differences in children's hearing aids adjusted according to the NAL-NL1 and the DSL v.4.1 prescriptions. Int J Audiol. 2010 Jan;49 Suppl 1:S16-25. DOI: 10.3109/14992020903082096
[43] Winneke AH, Schulte M, Vormann M, Latzel M. Effect of Directional Microphone Technology in Hearing Aids on Neural Correlates of Listening and Memory Effort: An Electroencephalographic Study. Trends Hear. 2020 Jan-Dec;24:2331216520948410. DOI: 10.1177/2331216520948410
[44] Larsby B, Hällgren M, Lyxell B, Arlinger S. Cognitive performance and perceived effort in speech processing tasks: effects of different noise backgrounds in normal-hearing and hearing-impaired subjects. Int J Audiol. 2005 Mar;44(3):131-43. DOI: 10.1080/14992020500057244