Concurrent categorical scaling of sound quality measures (CCSM) – a database of psychoacoustic measures roughness, sharpness, tonality, loudness and annoyance of artificial and real sounds
Lena Schell-Majoor 1,2Stephan D. Ewert 1,2
Birger Kollmeier 1,2,3
Jan Rennies 1,2,3
1 Department of Medical Physics and Acoustics, Carl von Ossietzky Universität Oldenburg, Germany
2 Cluster of Excellence Hearing4all, Oldenburg, Germany
3 Fraunhofer Institute for Digital Media Technology IDMT, Department for Hearing, Speech and Audio Technology, Oldenburg, Germany
Abstract
To connect sound quality with other psychoacoustic measures experimentally and for model evaluation, a benchmark set of simultaneously assessed measures with a large set of signals is highly desirable. Hence, two experiments were conducted, in which roughness, sharpness, tonality, loudness and annoyance were assessed for a total of 129 artificial and real sounds by normal-hearing listeners using a categorical scale. The instrumental loudness was equalized for most of the sounds to limit the influence of loudness. With test-retest correlation of r²>0.76 for all attributes, results indicated the reliability of the method. Correlation analyses and a multilinear regression revealed that, besides loudness, sharpness contributed most to annoyance (r²=0.72), while roughness (r²=0.04) and tonality (r²=0.08) did not contribute significantly. The present data set demonstrates the applicability of a categorical scale for the concurrent assessment of psychoacoustical properties and can serve as a basis for further research that is required to accurately model psychoacoustic measures for a broad range of signals.
Keywords
categorical scaling, sound quality, annoyance
Introduction
Sound quality evaluation is of interest in basic psychoacoustic research for the general understanding of human auditory perception and in practical applications, e.g., automotive and household appliances and hearing aids. One key aspect in the applied research is developing models for predicting sound quality of specific sounds. In this context, sound quality is assumed to be a complex perceptual measure depending on several factors, which can be associated with more basic psychoacoustic measures such as roughness, sharpness, tonality or loudness. One successfully applied method for predicting the overall quality of sounds is therefore to fit a linear combination of psychoacoustic measures to subjectively measured data of quality. The psychoacoustic measures are usually calculated computational models that are standardized or found in scientific (referred to as ‘instrumental measures’ in the following). There are several studies applying this method for a certain type of sound, e.g., the noise of photovoltaic inverters [1], laser printers [2], power tools [3], car pass-by noise [4] or washing machines [5], [6]. These instrumental measures, however, cannot generally be assumed to reflect human perception for arbitrary types of sounds they have not been validated for. It would be beneficial to use subjective data instead of instrumental measures for assessing the different psychoacoustic attributes, but obtaining them is very cost- and time consuming. Hence, datasets including subjective data on different psychoacoustics attributes and overall quality for a variety of different sounds are lacking. With this study we aim to contribute to fill this gap by investigating the influence of subjectively measured roughness, sharpness and tonality on subjective annoyance and also provide the corresponding data for further research.
Studies applying semantic differentials to evaluate sound quality, e.g., [7], [8], [9], usually include some of the psychoacoustic measures (e.g. sharp – dull or rough – smooth). However, the results do not provide a direct link to existing model approaches, because they include many more adjectives than basic psychoacoustic measures such as howling or whistling and also non-auditory items, e.g., powerful and weak, and the set of word pairs is different for different classes of sounds. Furthermore, [10] found a significantly higher correlation between instrumental and empirical loudness measures for scaling methods than for a scale derived from the adjective pair soft-loud. It is therefore unclear how results obtained from studies employing semantic differentials can be predicted by current instrumental measures.
Existing studies which not only rely on instrumental measures, but additionally include experimental assessments of psychoacoustic measures are mostly limited to one single measure (e.g., loudness) and do not additionally measure sound quality. One study obtaining a complete data set of psychoacoustic measures and an overall quality judgement was published by Aures [11]. This data set includes paired comparison evaluations (15 subjects) of 17 environmental sounds from [12] and magnitude estimations (8 subjects) of those environmental sounds as well as of several synthetic sounds like bandpass-filtered noise, pure tones and amplitude-modulated sounds. However, especially the magnitude estimation data have been collected with a rather limited number of subjects, which may be problematic due to the large interindividual variability typically observed in experimental evaluations of psychoacoustic quantities. As the data are not openly accessible they cannot be used easily for further analyses. Furthermore, paired comparison is in principle not comparable to scaled responses due to a kind of (nonlinear) magnification effect: Small differences are magnified, larger differences are compressed. A scale can be reconstructed from paired comparison only if sufficient data for intermediate steps are available. The relation between such an indirectly derived scale (using, e.g., BTL [13] or Fechnerian scaling [14]) and any direct (categorical) scaling is rather unclear.
Methods frequently used in psychoacoustic experiments are paired comparisons and classic magnitude estimation. The experimental effort for paired comparisons is rather large and both methods require a rather large experimental effort and an appropriate rescaling of the data to be comparable to the instrumental scales (e.g., the sone scale for loudness or asper scale for roughness). This problem is circumvented by categorical responses, i.e. categorical loudness scaling [15] with its modifications for clinical audiology usage [16], [17] or the recently adopted ACALES procedure [18] for assessing listening effort. The advantage of these methods is the well-described, though numerically restricted response scale (50 categorical units (CU) that are derived as subdivisions from 5 main categories plus upper and lower limits of the scale) and the avoidance of the logarithmic response bias by presenting only a very small number of easily conceptualized main categories (i.e., very little, little, some, much, and very much annoying) that are used as a kind of anchor prior to subdividing the response categories. On the contrary, known problems of categorical scaling procedures are the tendency of people to choose categories equally often and the dependency on the stimuli and their distribution across the scaled dimension [19], [20]. However, the methods are easily applicable to naïve subjects without much prior training and individual normalization. Hence, a direct comparison across subjects and labs is easier to achieve than with the classical magnitude scaling procedures. It could also be used in audiological contexts, where sound quality is also of interest to optimize hearing support, i.e., with hearing aids and cochlear implants (CIs), for individual listeners beyond speech intelligibility and loudness [21], [22], [23]. Nonetheless, a consistent usage of such categorical scales for sound quality assessments has not been reported before. This underlines the need for investigating the applicability of categorical scaling for sound quality research in psychoacoustics and audiology.
Hence, the overall objectives of this study are
- to provide and validate a method for simultaneously collecting experimental data on the psychoacoustic measures roughness, sharpness, tonality and loudness and on annoyance as a measure for sound quality with untrained subjects using a categorical response scale.
- to investigate to what extent the psychoacoustic measures contribute to annoyance for future work on sound quality models.
Therefore, in a series of two experiments, a total of 129 artificial and real sounds were assessed by normal-hearing listeners using the novel method outlined above.
Method
Two experiments were conducted that use the same method, apparatus and experimental procedure, but different sets of stimuli. As loudness was found to be one of the most important factors for sound quality in most studies on sound quality, we decided to put the focus on the other psychoacoustic measures in this study and equalized the instrumental loudness (as sounds were mainly stationary, loudness equalization was based on ISO 532 B/DIN 45631 with code from [24]) for most of the sounds in experiment 1. These sounds were mainly simple artificial sounds that were also used in other studies before. In experiment 2 mainly more complex, real sounds were used. A subset of the stimuli was the same in both experiments to assess the question to which degree the subjective ratings of the same stimuli were influenced by the entire set of stimuli in each experiment. The loudness model was used in the mode for diffuse sound field because the headphones used for presenting the sounds are diffuse field equalized.
1 Subjects
Thirty subjects participated in each experiment. Their age ranged from 20 to 32 years (experiment 1, median 25 years) and 20 to 32 years (experiment 2, median 25 years), respectively. Two subjects participated in both experiments. All subjects reported normal hearing abilities and had pure-tone thresholds of less than or equal to 20 dB HL at audiometric frequencies in the range 125 Hz to 8 kHz. Most of the subjects had not participated in listening studies before. The subjects were paid for their participation.
2 Stimuli
The stimuli included simple artificial sounds, which have been used in other studies before, and more complex, real stimuli, which are of interest for industrial applications. All sounds had a sample frequency of 44,100 Hz. A complete list of sounds can be found in Table 1 [Tab. 1], where a description of the sound, the instrumental loudness and the sound pressure level is given for each experiment. Seventy-four different sounds were presented in experiment 1. Four of them were recorded sounds, the remaining sounds were synthetic bandpass-filtered (BP) noises, amplitude-modulated (AM) tones, pure tones, and white noise. All sounds had a calculated loudness of 4 sone, except for the white noise (10 sone) and the pure tone with f=2 kHz (5 sone). We decided to present these very basic stimuli at 60 dB SPL as this is commonly used as medium input level in psychoacoustics [25] and might facilitate comparisons with data from other psychoacoustic experiments. For a pure tone with f=1 kHz this level also corresponds to a loudness of 4 sone. Three AM-sounds were presented twice to evaluate the reliability of the data within a session.
Table 1: List of sounds used in the experiments with instrumental loudness and sound pressure level with continuous numbering through both experiments. Sounds that were used for familiarization are marked in bold. 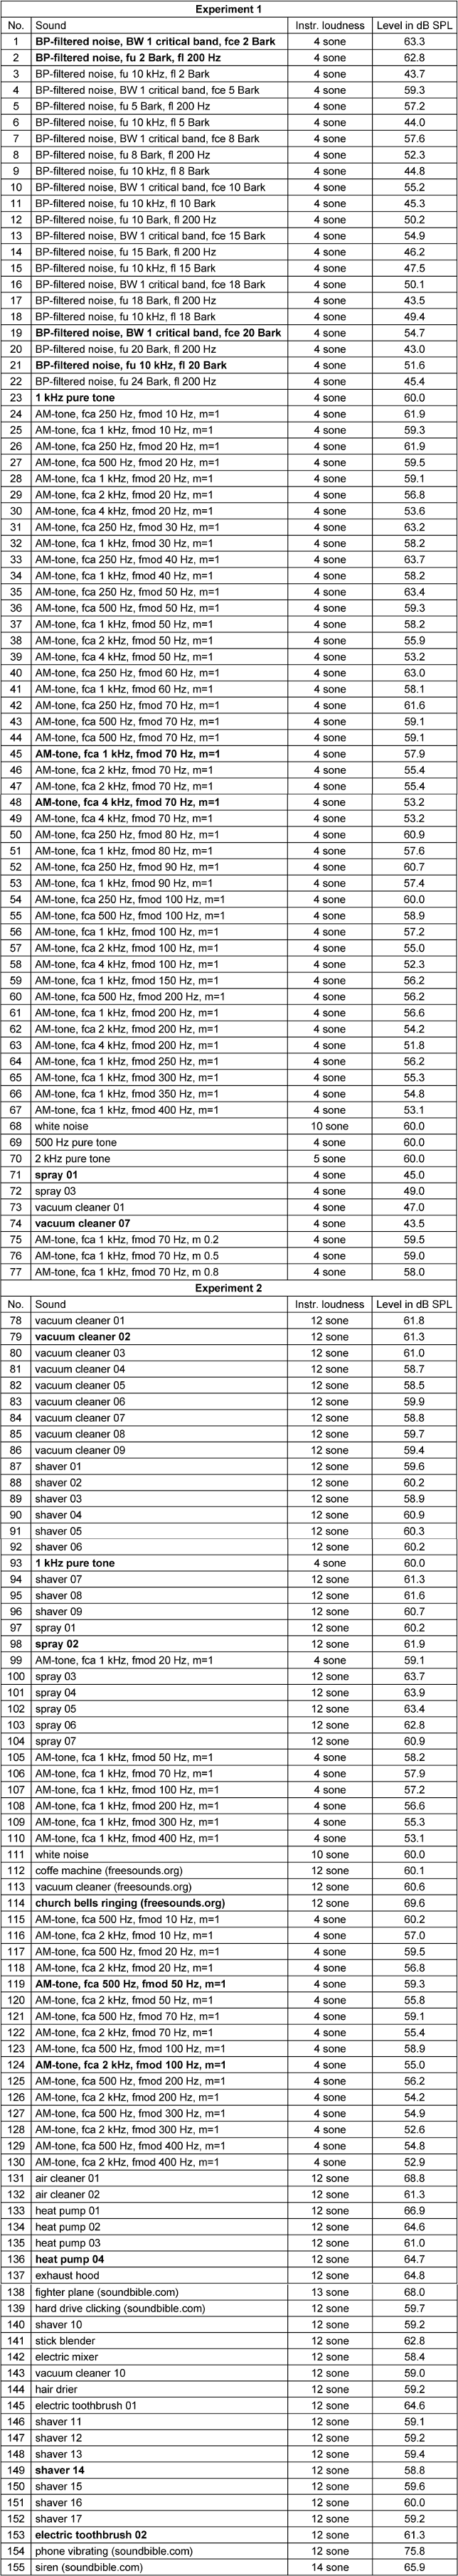
Experiment 2 included 78 sounds. 53 sounds were recorded signals. Most of them were presented at levels corresponding to an instrumental loudness of 12 sone, including those four sounds that were presented in experiment 1 where they had a loudness of 4 sone. The other sounds were white noise (10 sone), a 1-kHz pure tone (4 sone) and AM-tones (4 sone). Except for six additional AM-tones, all of these sounds were presented identically to experiment 1. A list of all sound pairs, i.e. sounds presented in both experiments, can be found in Table 2 [Tab. 2]. Most sounds had a duration of about 2 seconds. Due to their characteristics, some sounds were longer, e.g., the sound of church bells. The longest sound had a duration of 4 seconds. To avoid clicking at the beginning or the end of sounds, a Hann window with flanks of 1,000 samples, i.e. 22.6 ms, was applied and 4,096 zeros were added at the end of all sounds.
Table 2: List of pairs of sounds presented with the same instrumental loudness and levels in both experiments with continuous numbering and the number of the sounds in the experiments.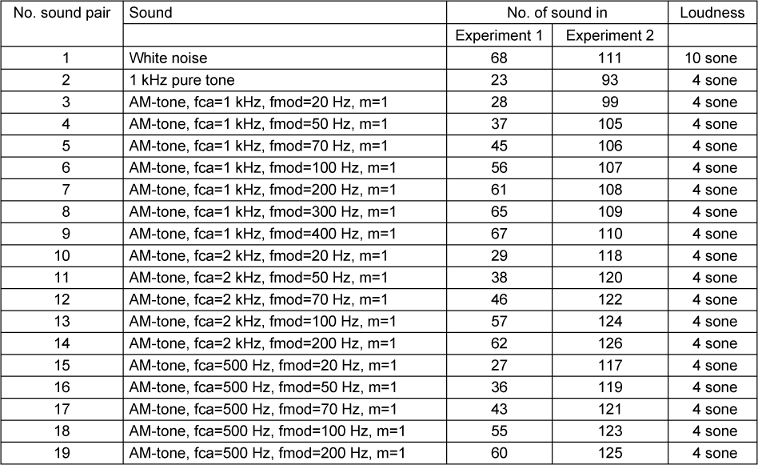
3 Apparatus and experimental procedure
The experiments were conducted individually for each subject in a sound-attenuating booth. All sounds were presented diotically via Sennheiser HD650 headphones. The transfer function of the headphones was not equalized. At the beginning of the experiment the subjects received written instructions mentioning the attributes to be rated (see below), but did not explain them. There were no sound examples or anchor sounds for the different attributes. As we assumed that the results might depend on how and to what extent subjects were instructed how to interpret the attributes, we decided not to give any instruction. This could lead to larger variations in the responses but was done in order to judge if subjects were intuitively able to assess the given attributes. Each session started with a pre-experimental phase, where subjects had to listen to nine sounds from the current set of stimuli to familiarize them with the range of stimuli to be expected in the main experiment. This familiarization was the same in the test and retest session, and the same sounds were used for all subjects. These sounds are marked bold in Table 1 [Tab. 1].
After the familiarization was completed, the sound scaling started. The procedure applied was a modified version of Heller’s category subdivision scaling [13]. The general idea is to combine five verbal categories with ten graduation steps each resulting in a 50-point scale. While in the original version it consisted of two ratings, one to choose the category and the second to grade the sound within the category, we decided to combine those steps in one rating to speed up the experiment. The result is a scale with numerical ticks from 0 to 50 every five units (see Figure 1 [Fig. 1], upper row). Above this numerical scale five verbal marks from “not” to “very” were displayed. The words (original German words: “nicht”, “etwas”, “mittelmäßig”, “ziemlich”, “sehr”) were taken from [26]. The original method was applied for evaluating loudness, but [27] already proposed that it could be an advantageous method for noise assessment as well. In our study subjects had to rate their perception of the five attributes roughness, sharpness, tonality, loudness and annoyance (original German words: “Rauigkeit”, “Schärfe”, “Tonhaltigkeit”, “Lautheit”, “Lästigkeit”) concurrently for each sound using sliders. The sliders were arranged one below the other, each labeled with one of the five attributes in the order given above (see Figure 1 [Fig. 1]). The initial position of all sliders was 0 at the beginning of each rating. Above the upper slider the numerical and verbal marks were displayed. All sliders were always active, so subjects could switch between rating the different attributes for one sound and change them until they confirmed the given ratings. Each slider had to be moved at least once before the ratings could be confirmed. Once the ratings were confirmed, subjects could neither see nor change past ratings. The order of the sounds was randomized for each subject. The subjects had to take a break after each 26 sounds for as long as they wanted and they could additionally pause after any assessed sound when needed. The duration of each session including a little less than 80 sounds was approximately one hour: Estimating 15–20 minutes for instruction, familiarization, and breaks, the assessment of the five dimensions for each sound took about 30 seconds, in which subjects could repeat the sound as often as desired. Each subject participated in two sessions (test and retest) with a minimal distance of one week in between.
Figure 1: Original graphical user interface (GUI) for sound scaling how rough, sharp, tonal, loud and annoying a sound is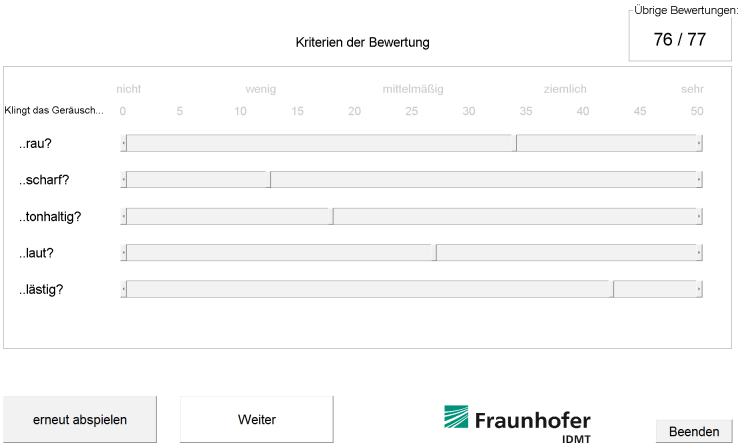
Results
All results were analyzed using median values including test and retest ratings of each subject, except for the analysis of the test-retest correlation. All correlations given refer to the determination coefficient, denominated r² within this paper.
1 Reliability of the experimental method
To assess the reliability of the method we analyzed if results are reproducible by comparing ratings for the same sounds during different instances in the experiments.
a) Repeated ratings of sounds within one session of experiment 1
To find out if rating criteria for the different attributes were stable within one session, we compared median values of first and second ratings of the three sounds presented twice in each session of experiment 1. The sounds were AM-tones with carrier frequencies of fca=0.5, 2 and 4 kHz, a modulation frequency of fmod=70 Hz and degree of modulation of m=1. Figure 2 [Fig. 2] displays the distribution of the differences between all first and second ratings, i.e. from the test and the retest session, for the sounds that were presented twice in each session. The numbers of the sounds refer to Table 1 [Tab. 1], which show that the same sound is presented for both numbers of each sound pair. As can be seen from Figure 2 [Fig. 2], the main body of the distribution is mostly confined by the dotted reference lines at ±5 CU. Table 3 [Tab. 3] complementarily shows the mean absolute differences over all individual ratings for each attribute and each pair of sound, which lie between 5.11 CU and 10.05 CU. The largest mean absolute differences were found between sound 48 and 49 (fca=4 kHz) for all attributes. Comparing the values for the different attributes, loudness has the lowest mean absolute difference for two of the three sound pairs (fca=2 and 4 kHz). The differences between the median values of the ratings for the same sound, i.e. including ratings from the test and retest session, are also displayed in Table 3 [Tab. 3] and were also mostly smaller than 5 CU, except for the differences of median sharpness and annoyance between sound 46 and 47 (fca=2 kHz) with 6.9 and 5.6 CU, respectively. These results indicated that subjects had rather clear and stable rating criteria: individual ratings for the same stimulus within one session exhibited average differences of 5–10 CU, median ratings could be reproduced with a precision of roughly 5 CU, which corresponds to about half a verbal category.
Figure 2: Distribution of differences between all first and second ratings of the three sounds that were rated twice within one session of experiment 1, i.e., AM-tone stimuli with the appropriate numbers from Table 1. As a comparison the distribution of differences between test and retest ratings of all stimuli are platted additionally. The plots show the median value as circles, the distribution of data as grey area with interquartile ranges colored in dark grey. Reference dashed, dotted, and dash-dotted lines are shown for differences of 0, ±5 and ±15 categorical units, respectively.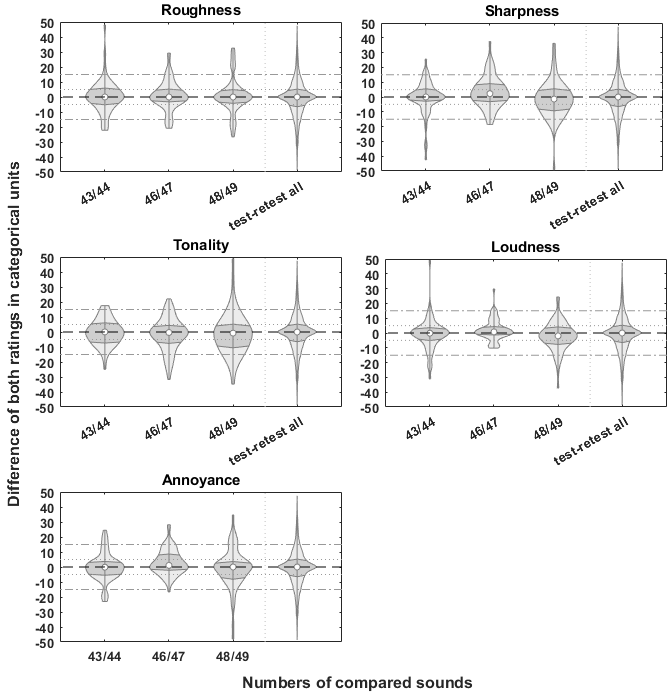
Table 3: Mean absolute values of the differences between individual first and second ratings (upper part) and differences between the median ratings (lower part) of the three sounds that were rated twice within one session of experiment 1, i.e., AM-tone stimuli with the appropriate numbers from Table 1.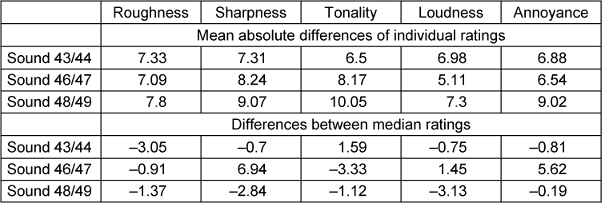
b) Test and retest ratings of both experiments
We also investigated if subjects were able to reproduce their ratings in a retest session. The order of the sounds was randomized in both sessions. The research question was if rated attributes were stable over time and led to reliable results. Figure 3 [Fig. 3] relates the median ratings in the test session to those in the retest session. The correlations for the different attributes ranged from r²=0.81 for roughness to r²=0.91 for tonality in experiment 1, and from r²=0.76 for loudness and r²=0.96 for tonality and roughness in experiment 2. In the subplots for loudness (4th column of Figure 3 [Fig. 3]) the reduced variance in loudness ratings is visible, which is due to the instrumental equalization of most sounds. The single datapoint in experiment 1 in the upper right corner represents ratings for white noise, which had a clearly higher instrumental loudness with 10 compared to 4 and 5 sone of the other sounds. The outlier in experiment 2 (lower left corner of lower plot in 4th column) is the sound of a clicking hard-drive, which is not stationary. The instrumental loudness might, thus, be incorrect. We also calculated the overall bias as the value by which one set of data had to be shifted in order to minimize the root-mean-square difference. For experiment 1 these biases were 2.17, –0.3, 0.05, –0.81 and –2.68 CU and for experiment 2 biases of 0.49, 0.45, 1.98, –0.01 and –1.15 CU were found for roughness, sharpness, tonality, loudness and annoyance, respectively. As these biases were smaller than 3 CU in experiment 1 and smaller than 2 CU in experiment 2, we assumed that there was no systematic difference between test and retest ratings. This assumption is supported by a Wilcoxon rank sum test which was used to test if the test and retest ratings for the five attributes can be assumed to come from distributions with equal medians. The test provides the following z-values and p-values for the ratings of roughness, sharpness, tonality, loudness and annoyance: z=–0.98, –0.04, –0.8, 1.05, 1.86 and p=0.33, 0.97, 0.43, 0.29 and 0.063, respectively. These values indicate that there is no difference between test and retest ratings for a 5% level of significance. Note, however, that the p-value for annoyance is close to the criterion of 0.05 and thus not presenting conclusive evidence that there is no difference.
Figure 3: Relation of median test and retest ratings for experiment 1 (upper row) and experiment 2 (lower row) with determination coefficients for each attribute. The data show median values for each sound calculated over all subjects, reference lines are shown for deviations of 0 and ±5 categorical units.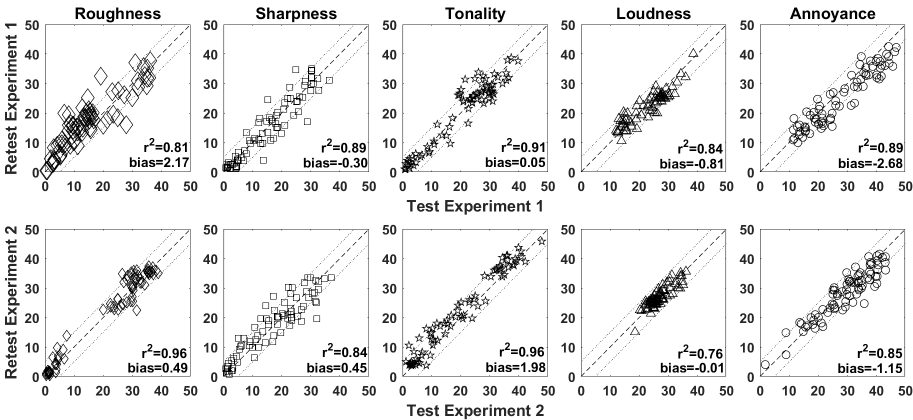
The internal variability, i.e., the deviation for the same subject performing the same task, can hence be estimated to approx. 5 CU (again corresponding to about half a verbal category) which is in good agreement with the literature, e.g. for categorical loudness scaling [28], where the variance was estimated to 4 CU. Altogether, the results suggest that ratings were stable over time and support the assumption that subjects had rather distinct rating criteria for all attributes.
c) Comparisons of ratings from experiment 1 and experiment 2
Nineteen presented sounds were identical in both experiments, i.e. also with same level. These sounds pairs have an additional numbering as given in Table 2 [Tab. 2]. We compared ratings from both experiments to investigate the influence of the set of stimuli, i.e. the context, on ratings for the different attributes. Figure 4 [Fig. 4] shows the distribution of differences between the median ratings of both experiments for the 19 sounds. Note that the deviations across experiments were much larger (i.e., up to 50 CU) than those reported for the same stimuli in the same experiment in section 1a even though the same stimuli were rated – albeit in a different context between both experiments. For each experiment, the median was calculated across subjects and across ratings from test and retest session. The numbers on the x-axis refer to the number of the sound pairs given in Table 2 [Tab. 2]. Medium to high correlations were found, ranging from r²=0.42 for loudness to r²=0.88 for tonality. For sharpness, tonality and annoyance the correlation was high (r²=0.80, r²=0.88 and r²=0.74, respectively), so relative ratings were similar in both experiments. Roughness did not seem to be rated as stably (r²=0.67). For loudness, the correlation was lower (r²=0.42), which might be due to the small range of perceived loudness as a result of the (instrumental) loudness equalization which might lead to large uncertainties. Regarding the absolute values of the ratings, the bias was calculated as explained in 1b. It revealed that there is some dependance of the context so sounds tended to be rated as less rough (bias 5.9 CU), sharper (bias –4.6 CU) and much more tonal (bias –8.2 CU) in experiment 2 than in experiment 1. For the other attributes the bias was smaller than 3 CU (loudness 2.5 CU, annoyance 0.9 CU).
Figure 4: Differences, coefficients of determination and bias between median ratings of the five attributes for each sound pair calculated over all subjects. Sound pairs are sounds presented identically in both experiments, i.e. with the same calculated loudness (see Table 2). Reference lines indicate differences of 15, 0 and –15 categorical units.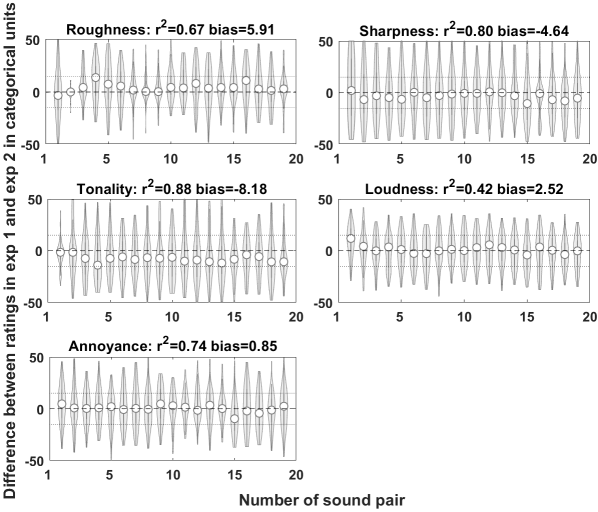
To check if these differences were caused by a range effect rather than a context effect, i.e., a significantly different range of judgements across both experiments that may be caused by the different properties and statistics of the presented stimuli, average ratings for each attribute were compared across experiments. We did this by computing the median for each attribute over all sounds from experiment 1 and over all sounds from experiment 2 and compared these by calculating the difference between the median values from both experiments for each attribute. The differences between overall median ratings of experiment 1 and 2 were rather small with –3.1 CU, 4.7 CU, –2.5 CU and –5.3 CU for sharpness, tonality, loudness and annoyance, respectively. For roughness, the difference was larger where the median rating was 12.9 CU higher in experiment 2. The sounds in experiment 2 were, thus, less rough than in experiment 1 and this most probably led to a decreased roughness rating for the same sound in experiment 2 compared to experiment 1. For the other attributes the differences between the ratings of the same sounds seemed not to be caused by a general offset. Altogether, the results indicate a small influence of the set of stimuli on annoyance.
2 Relation between psychoacoustic measures and annoyance
a) Influence of psychoacoustic measures on annoyance
To investigate to what extent the different basic psychoacoustic measures contribute to annoyance we correlated ratings for each psychoacoustic measure with annoyance ratings as shown in Figure 5 [Fig. 5]. Sharpness has the highest correlation with annoyance with r²=0.72, loudness yields a correlation of r²=0.44 with annoyance. Tonality and roughness are not correlated with annoyance yielding r²=0.08 and r²=0.04, respectively. We also analyzed how the attributes correlate with annoyance for subgroups of the stimuli (noises and tones) to test if the contribution of the different attributes to annoyance changed with the class of sounds. The noise group consisted of 23 sounds including all BP-noise and white noise from experiment 1. The tone group consists of 49 sounds and includes all pure and amplitude-modulated sounds from experiment 1. All of these sounds were generated sounds from experiment 1. The correlation values for the groups do not change much compared to those for the complete set of stimuli (roughness noise: r²=0.00, tones r²=0.02; sharpness: noise r²=0.66, tones r²=0.88; tonality: noise r²=0.00, tones r²=0.01; loudness: noise r²=0.46, tones r²=0.40).
Figure 5: Median ratings of psychoacoustic measures versus median annoyance ratings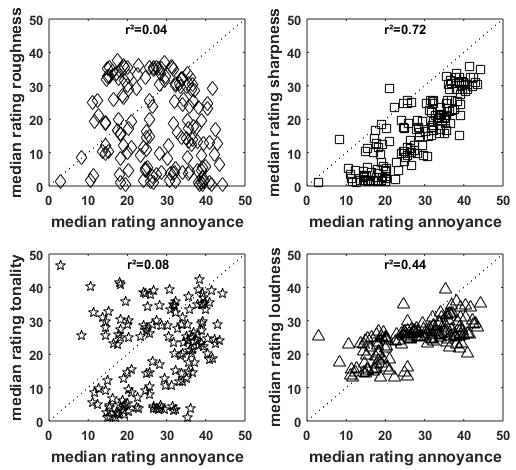
In conclusion, the results show a high correlation for sharpness with annoyance, a medium correlation for loudness with annoyance and no correlations for roughness and tonality with annoyance for the investigated sets of stimuli.
b) Multilinear regression
Regression analyses were run to find regression coefficients explaining the annoyance ratings on the basis of the ratings of the psychoacoustic measures. For these analyses, three sets of data were defined: data from experiment 1 (exp1), from experiment 2 (exp2) or the data from both experiments (all). First, these different data sets were used as input to the regression analysis. The regression coefficients (c1 to c5) from each analysis were then used to calculate the annoyance of these different data sets as
The calculated annoyance was then correlated with the experimental annoyance ratings in order to quantify the quality of the predictions. This was also done for the different groups. The determination coefficients for all combinations of input data and predicted data are shown in Table 4 [Tab. 4]. Generally, results show that annoyance can be predicted well from subjectively rated roughness, sharpness, tonality and loudness yielding r²≥0.7. Predicting the annoyance for independent data, i.e. for the sounds from experiment 1 with regression coefficients obtained with data from experiment 2 or the other way around, results in similar correlations (r²=0.79 and r²=0.7, respectively). Predicting the annoyance for the same data that was used for regression analysis, i.e., data of experiment 1 from the regression coefficients estimated from experiment 1 (and, similarly, for experiment 2 and the group of all sounds) reveals the remaining prediction error of an “optimum” linear predictor which reflects the amount of remaining variance in the annoyance data that cannot be attributed to the other psychoacoustic measures in a simple linear regression model. To quantify the proportion of the influence of the input variables, i.e., the different attributes, for the regression we built a model for each attribute with only the intercept and one variable using the complete dataset. Then r² was calculated leading to r²=0.04, 0.72, 0.08 and 0.44 for roughness, sharpness, tonality and loudness, respectively. Additionally, Δr² was calculated, i.e., the difference in r² when successively adding attributes to the sharpness-only model according to their r² stated above, amounting to Δr²=0.12 when adding loudness and Δr²<0.01 when additionally adding tonality and roughness. Hence, sharpness and loudness contribute the largest information for the calculation of annoyance.
Table 4: Determination coefficients r2 between annoyance ratings from the experiments and annoyance predictions as a result from different multilinear regression analyses. The different columns indicate which set of experimental data was used as input for the regression analysis to obtain the regression coefficients. The rows indicate for which set of data annoyance was predicted. The predicted annoyance was correlated with the data set used as input for the regression.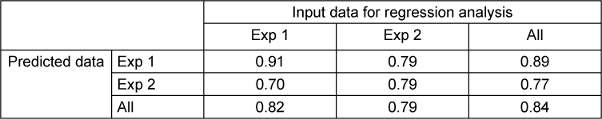
Discussion
1 Practicability & reliability of method
The proposed method of concurrent categorical scaling is quick compared to, e.g., paired comparison experiments and is useful for evaluating a large set of sounds. One session with about 80 sounds and five attributes takes roughly one hour per subject. As the attributes were not explained, the present data suggest that this method can be applied even for unexperienced subjects without training. As loudness equalization was performed with a model for stationary loudness, presentation levels and corresponding ratings might change when applying more sophisticated loudness models as described, e.g., in ISO 532-2 or 532-3. The median data presented here for the different psychoacoustic measures and annoyance for a broad range of sounds can be assumed to be reliable. Guski states that “in general, data which show [test-retest correlations; note from the author] rtt>0.80 are considered to be reliable” [29]. The present data meet this requirement. Additionally, differences smaller than 6 CU were found between ratings of the same sound within one session. The test-retest biases were smaller than 3 CU in experiment 1 and smaller than 2 CU in experiment 2, which translates to less than half a verbal category. For attributes with comparatively large biases, i.e., for roughness in experiment 1 (bias=2.17 CU) and tonality in experiment 2 (bias=1.98 CU) the bias from the other experiment (roughness in experiment 2: bias=0.49 CU and tonality in experiment 1: bias=0.05 CU) does not indicate systematic deviations introduced by the method. Annoyance, however, showed absolute biases>1 CU in both experiments (bias=–2.68 and –1.15 CU) and a p-value close to criterion for a significant difference between test and retest data. This might indicate a small actual negative bias and should be further examined in future studies to clarify the interpretation. Nevertheless, these findings generally support the reliability of the data and are also in line with test-retest differences of 5–7 CU found for loudness scaling [16].
2 Availability of data set
Subjective data for different attributes regarding sound quality for such a large set of stimuli has not been available so far. With this study we provide such a set of data that can be used in further studies to validate models for roughness, sharpness, tonality or annoyance on Zenodo [30]. For the validation of loudness models the reduced range of loudness has to be considered which limits the usage of the current data set e.g., for evaluating loudness models.
3 Influence of psychoacoustic measures on annoyance
The concept of annoyance in our study is driven by the interleaved presentation of a large number of stimuli (with mostly the same instrumental loudness) and a simultaneous categorical rating in different dimensions without providing a reference frame or specific instructions to the subject. Hence, the subjects are supposed to perform the judgement primarily without any prejudice or expectations about the signals presented. In addition, given the fact that loudness differences were comparatively small in our study, its otherwise dominating influence on annoyance is supposed to be rather limited. This concept resembles in essence the “unbiased annoyance” introduced by Zwicker in [31] as the annoyance that is created “when (a) the subject has no relation to the sound producing the annoyance and when (b) the annoyance is exclusively produced by sound and when (c) the boundary conditions of the measurements […] are describable and reproducible.” His results showed a strong influence of loudness, sharpness and only a small influence of roughness. Additionally, an influence of fluctuation strength was reported, which refers to amplitude modulations with rather low modulation frequencies reaching a maximum for a modulation frequency of 4 Hz. According to Zwicker’s description, fluctuation strength influences unbiased annoyance especially at low levels of sound. Since this has to be considered at night-time, Zwicker even included a factor for higher annoyance during night-time. In our study, no sounds with strong low-frequency-modulation were included and ratings did not refer to night-time or sleeping. Notwithstanding these factors, our results are compatible with the unbiased annoyance with strong influences of loudness and sharpness and no significant influence of roughness, even though a quantitative comparison of coefficients is not feasible, unbiased annoyance is described with a non-linear function.
Taking into account that loudness differences were comparatively small in our study, the most dominant factor in our data is sharpness which is in line with findings from several other studies, e.g., [25], [31] and [32]. In addition, other studies also found significant influences of roughness, e.g. in [1] and [5], and of tonality [5] on sound quality. One reason could be that the influence of the different measures varies for different classes of sounds. However, we did not find a dependence of sound classes when we analyzed the correlation for the groups of noise and tone stimuli separately. Another possible reason for this discrepancy might be that most of the studies quantified the influence of instrumental psychoacoustic measures, while in our data they were rated subjectively. As instrumental psychoacoustic measures are usually developed using specific artificial sounds, e.g. AM-modulated tones for roughness and bandpass-filtered noise for sharpness [25], the instrumental values might not align as well with subjective human perception of other sounds, especially arbitrary real sounds. The differences between instrumental and subjectively measured psychoacoustic measures might then affect how much the different psychoacoustic measures contribute to perceived annoyance. Hence, roughness and tonality should not be neglected, as their role is not so clear when comparing our results to other results from literature.
Obviously, there are several algorithms for calculating psychoacoustic measures and they are often validated only with narrow classes of sounds. Furthermore, subjective data are often not available but only generalized fitted curves are shown. Therefore, instrumental measures might not always correspond to subjective ratings and lead to different correlation values. Hence, a data-driven approach like the one presented here should lead to more refined algorithms for psychoacoustic measures. It has to be taken into account, however, that algorithms typically output values on a ratio scale, while human perception is not naturally reported on such a scale, which also holds for data provided in this study. Inherent limitations are the applicability for small effects within rather homogeneous sets of sounds and for expert evaluation of sounds. At least, our approach should provide a better understanding of the limits in applying the algorithms developed so far.
Generally, the results of this study provide evidence that in the set of subjective data presented in this study, sharpness, besides loudness, is the psychoacoustic measure mostly contributing to annoyance, even for naïve subjects that have not been especially instructed or trained towards a specific pattern a sharp sound should adhere to. The multilinear regression analysis showed that the annoyance can be predicted by combining these psychoacoustic measures quite well for our data. As the role of roughness and tonality is not so clear, especially for sounds beyond our range of stimuli, they are also included as predictors in the general model. Hence, our study demonstrates the applicability of the approach to predict the annoyance with information on psychoacoustic measures since correlation coefficients were high with r²≥0.7.
Limitations that need to be considered for further interpretation of the data, especially with regards to its generalizability, are as follows: Despite its broadness, the dataset still remains limited in terms of represented sounds and listeners. It has to be emphasized that all subjects were normal-hearing and AM-tones constitute the largest group among the stimuli. Furthermore, the method of simultaneous rating of different attributes might increase correlations among the attributes, i.e., also with annoyance, compared to separate ratings for each attribute. While we implemented measures to mitigate methodical biases, e.g., combining verbal and numerical marks and including a phase to familiarize subjects with the range of sounds, residual biases might still exist. However, the challenge for modeling sound quality seems to be to find generalizing models beyond linear regression that provide valid information on the psychoacoustic measures and better represent human perception even with unseen signal classes and ultimately also for impaired hearing with and without hearing aids. Corresponding approaches could utilize, e.g., physiologically motivated auditory models [33] or machine learning approaches [34]. The data provided here might be a good benchmark for further development of such models.
Conclusions
The following main conclusions can be drawn from this study:
- The concurrent categorical scaling method (CCSM) presented in this study enables a quick evaluation of sound quality with different attributes and is suitable for studies with unexperienced listeners. It leads to reliable group-level results for a given set of stimuli with test- retest correlations of r²>0.76 and biases smaller than 3 CU for all attributes even though subjects received no special introduction to the attributes and did not receive any examples as prior information.
- A large set of subjective data on roughness, sharpness, tonality and annoyance for a set of stimuli comprising of different types of noises, AM-tones, recordings of vacuum cleaners, heat pumps, shavers and further technical sounds is provided for further research, e.g., for validating modeling approaches. It is available at Zenodo [30].
- Categorical annoyance can be predicted well by subjectively rated categorical roughness, sharpness, tonality and loudness yielding correlation coefficients r²≥0.7. Further analyses of the attributes revealed that subjectively rated sharpness contributes most to the annoyance of the investigated set of sounds (r²=0.72) in our experiment with equalized instrumental loudness across stimuli that limited the influence of loudness. Roughness (r²=0.04) and tonality (r²=0.08) do not contribute to annoyance for these stimuli. The results are in line with Zwicker’s unbiased annoyance. Therefore, it seems reasonable to emphasize sharpness besides loudness for approaches towards generalized sound quality models.
Data
The research data associated with this article are available in Zenodo, under the reference https://doi.org/10.5281/zenodo.12819234 [35].
Where indicated in Table 1 [Tab. 1], sounds are scaled excerpts from sounds taken from online-databases and available under the given links:
Nr. 112: https://freesound.org/people/tpd/sounds/263901/
Nr. 113: https://freesound.org/people/tpd/sounds/263902/
Nr. 114: https://soundbible.com/253-Church-Bells-Ringing.html
Nr. 138: https://soundbible.com/2076-Fighter-Plane-Squadron.html
Nr. 139: https://soundbible.com/1951-Hard-Drive-Clicking.html
Nr. 154: https://soundbible.com/1994-Phone-Vibrating.html
Nr. 155: https://soundbible.com/1937-Tornado-Siren-II.html
Notes
Funding and acknowledgements
This study was supported by the Deutsche Forschungsgemeinschaft (DFG, FOR 1732 – Individualisierte Hörakustik) and the Ministry for Science and Culture of Lower Saxony, Germany. The funding sources were not involved in study design, the collection, analysis and interpretation of data or writing the article and submitting it for publication. The authors would like to thank Marcel Schulze for his help in data collection and Carolin Feldmann, Gerhard Krump and Carl Stückrath and Andreas Moehring for providing sounds for experiment 2.
Competing interests
The authors declare that they have no competing interests.
References
[1] Ellermeier W, Kattner F, Kurtze L, Bös J. Psychoacoustic Characterization of the Noise Produced by Photovoltaic Inverters. Acta Acustica united with Acustica. 2014;100(6):1120-8. DOI: 10.3813/AAA.918791[2] Kim E-Y, Shin TJ, Lee S-K. Sound quality index for assessment of sound quality of laser printers based on a combination of sound metrics. Noise Control Engineering Journal. 2013;61(6):534-46.
[3] Horvat M, Domitrovi H, Jambrošić K. Sound Quality Evaluation of Hand-Held Power Tools. Acta Acustica united with Acustica. 2012;98(3):487-504. DOI: 10.3813/AAA.918532
[4] Altinsoy ME. The Evaluation of Conventional, Electric and Hybrid Electric Passenger Car Pass-By Noise Annoyance Using Psychoacoustical Properties. Applied Sciences. 2022;12(10):5146. DOI: 10.3390/app12105146
[5] Jeong UC, Kim JS, Jeong JE, Yang IH, Oh JE. Development of a sound quality index for the wash cycle process of front-loading washing machines considering the impacts of individual noise sources. Applied Acoustics. 2015;87:183-9. DOI: 10.1016/j.apacoust.2014.06.001
[6] Moravec M, Ižariková G, Liptai P, Badida M, Badidová A. Development of psychoacoustic model based on the correlation of the subjective and objective sound quality assessment of automatic washing machines. Applied acoustics. 2018;140:178-82.
[7] Hülsmeier D, Schell-Majoor L, Rennies J, van de Par S. Perception of sound quality of product sounds-A subjective study using a semantic differential. In: Davy J, editor. INTERNOISE 2014 - 43rd International Congress on Noise Control Engineering: Improving the World through Noise Control; Melbourne, Australia, 16-19 November 2014. 2014.
[8] Kidd GR, Watson CS. The perceptual dimensionality of environmental sounds. Noise Control Eng J. 2003;51(4):216. DOI: 10.3397/1.2839717
[9] Kuwano S, Fastl H, Namba S, Nakamura S, Uchida H. Quality of door sounds of passenger cars. Acoustical Science and Technology. 2006;27(5):309-12. DOI: 10.1250/ast.27.309
[10] Zeitler A, Hellbrück J. Semantic attributes of environmental sounds and their correlations with psychoacoustic magnitude. In: Alippi A, editor. Proceedings of the 17th International Congress on Acoustics 2001. Rome; 2001.
[11] Aures W. Der sensorische Wohlklang als Funktion psychoakustischer Empfindungsgrößen. Acustica. 1985;58:282-90.
[12] Terhardt E, Stoll G. Skalierung des Wohlklangs (der sensorischen Konsonanz) von 17 Umweltschallen und Untersuchung der beteiligten Hörparameter. Acta Acustica united with Acustica. 1981;48: 247-53.
[13] Zimmer K, Ellermeier W. Deriving ratio-scale measures of sound quality from preference judgments. Noise Control Eng J. 2003;51(4):210. DOI: 10.3397/1.2839716
[14] Dzhafarov, Ehtibar N, Colonius H. Multidimensional fechnerian scaling: basics. J Math Psychol. 2001;45(5):670-719.
[15] Heller O. Hörfeldaudiometrie mit dem Verfahren der Kategorienunterteilung (KU). Psychologische Beitrage [Audiometry of hearing range by means of a category splitting procedure]. Psychologische Beitrage. 1985;27(4):478-93.
[16] Kollmeier B, editor. Hörflächenskalierung: Grundlagen und Anwendung der kategorialen Lautheitsskalierung für Hördiagnostik und Hörgeräte-Versorgung. Median-Verlag; 1997.
[17] Brand T, Hohmann V. An adaptive procedure for categorical loudness scaling. J Acoust Soc Am. 2002;112(4):1597-604. DOI: 10.1121/1.1502902
[18] Krueger M, Schulte M, Brand T, Holube I. Development of an adaptive scaling method for subjective listening effort. J Acoust Soc Am. 2017;141(6):4680. DOI: 10.1121/1.4986938
[19] Marks LE, Gescheider GA. Psychophysical Scaling. In: Wixted JT, editor. Stevens' Handbook of Experimental Psychology, Methodology in Experimental Psychology. John Wiley & Sons; 2002. p. 91-138.
[20] Marks LE, Florentine M. Measurement of Loudness, Part I: Methods, Problems, and Pitfalls. In: Florentine M, Popper AN, Fay RR, editors. Loudness. New York, NY: Springer; 2011. p. 17-56. (Springer Handbook of Auditory Research; 37).
[21] Gößwein JA, Rennies J, Huber R, Bruns T, Hildebrandt A, Kollmeier B. Evaluation of a semi-supervised self-adjustment fine-tuning procedure for hearing aids. Int J Audiol. 2023;62(2):159-71. DOI: 10.1080/14992027.2022.2028022
[22] Glista D, Hawkins M, Vaisberg JM, Pourmand N, Parsa V, Scollie S. Sound Quality Effects of an Adaptive Nonlinear Frequency Compression Processor with Normal-Hearing and Hearing-Impaired Listeners. J Am Acad Audiol. 2019;30(7):552-63. DOI: 10.3766/jaaa.16179
[23] Dorman MF, Natale SC, Buczak N, Stohl J, Acciai F, Büchner A. Cochlear Implant Sound Quality. J Speech Lang Hear Res. 2025;68(1):323-31. DOI: 10.1044/2024_JSLHR-23-00678
[24] University of Salford. [cited 2014 September 10]. Available from: https://www.salford.ac.uk/computing-science-engineering/research/acoustics/psychoacoustics/sound-quality-making-products-sound-better/sound-quality-testing/matlab-codes
[25] Zwicker E, Fastl H. Psychoacoustics: Facts and models. 3rd ed. Berlin, Heidelberg: Springer; 2010.
[26] Rohrmann B. Empirische Studien zur Entwicklung von Antwortskalen für die sozialwissenschaftliche Forschung. Zeitschrift für Sozialpsychologie. 1978;(9):222-45.
[27] Hellbrück J. Category-subdivision scaling – A powerful tool in audiometry and noise assessment. Recent trends in hearing research. 1996:317-36.
[28] Brand T, Hohmann V, Kollmeier B. Wie genau ist die kategoriale Lautheitsskalierung. In: Kollmeier B, editor. Hörflächenskalierung - Grundlagen und Anwendungen der kategorialen Lautheitsskalierung für Hördiagnostik und Hörgeräte-Versorgung. Median-Verlag: Heidelberg; 1997. p. 121-45.
[29] Guski R. Psychological Methods for Evaluating Sound Quality and Assessing Acoustic Information. Acta Acustica united with Acustica. 1997;83:765-74.
[30] Schell-Majoor L, Kollmeier B, Ewert S, Rennies J. Concurrent categorical scaling of sound quality measures (CCSM) – Database of psychoacoustic measures roughness, sharpness, tonality, loudness and annoyance of artificial and real sounds. Zenodo; 2024. DOI: 10.5281/zenodo.13683339
[31] Zwicker E. A Proposal for Defining and Calculating the Unbiased Annoyance. In: Schick A, editor. Contributions to Psychological Acoustics. BIS: Oldenburg; 1991. p. 187-202.
[32] Kuwano S, Namba S, Takehira O, Fastl H. Subjective impression of copy machine noises: An examination of physical metrics for the evaluation of sound quality. In: 38th International Congress and Exposition on Noise Control Engineering 2009, INTER-NOISE 2009. Ottowa; 2009. p. 746-52.
[33] Schell-Majoor L. Objective Quality Assessment of Product Sounds [dissertation]. 2018.
[34] Pourseiedrezaei M, Loghmani A, Keshmiri M. Development of a Sound Quality Evaluation Model Based on an Optimal Analytic Wavelet Transform and an Artificial Neural Network. Archives of Acoustics. 2021;46(1):55-65. DOI: 10.24425/aoa.2021.136560
[35] Schell-Majoor L, Kollmeier B, Ewert S, Rennies J. Concurrent categorical scaling of sound quality measures (CCSM) – Database of psychoacoustic measures roughness, sharpness, tonality, loudness and annoyance of artificial and real sounds. Version v1. Zenodo; 2024 Jul 25. DOI: 10.5281/zenodo.12819234