[Kommentar zu „An efficient crossover design for thorough QT studies“ von Ring et al.]
Ling Chen 1Yu-Ting Weng 1
1 Office of Biostatistics, Center for Drug Evaluation and Research, U.S. Food and Drug Administration, Silver Spring, United States
Letter to the editor
In 2010 Ring et al. [1] proposed a five-period thorough QT (TQT) study design incorporating two placebo treatments. They claim that this design reduces sample size compared to four-period studies, lowering overall study costs by about 10% (where cost equals sample size × study periods), and the design also reduces active treatment exposure, benefiting drugs with critical safety profiles. The sample size reduction stems from decreased variability in placebo estimates, which are effectively halved. Consequently, the variance ratio between five-period and four-period designs is ¾.
We note that the result implicitly assumes the two treatments being compared are uncorrelated. However, this assumption is not realistic. Subject responses to different treatments in a crossover design are generally correlated due to the within-subject comparison structure where each subject acts as their own control. The existence and magnitude of this correlation are key factors in the design and analysis of these studies.
Let T and P denote an active treatment (therapeutic dose or supratherapeutic dose) and placebo, respectively, and let rT,P be the correlation between them in a four-period design. The variance of the treatment differences for the four-period design is 2 (1–rT,P)  , where denotes the common within subject variability.
In the five-period design study, there are two placebo periods. Let P1 and P2 denote the two placebos, and  be the correlation between them.
The variance of (P1+P2)/2 is  . Therefore, the variance ratio between five-period and four-period designs is:
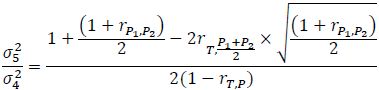
where σ4 and σ5 represent the standard deviations of the treatment differences for the four- and five-period designs, respectively, and  denotes the correlation between T and (P1+P2)/2 in the five-period design. The above variability ratio equals ¾ when all correlations are equal to zero.
If the correlation between paired treatments is unknown, a value of 0.5 may be used in the sample size calculation for a paired t-test. The sample size calculated using a correlation of 0.5 between two treatments for a paired t-test is equivalent to that obtained using the t-test on the mean of treatment differences.
Assume:
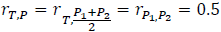
Then:
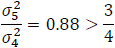
Note that QT interval is an objective endpoint. When two placebos are used in a TQT study, it is expected that a subject's response to the two placebos would be highly correlated, as both represent the same baseline physiological state. Thus, it is reasonable to assume that >0.5. For example, if we assume  =0.8 and rT,P==0.5, then:

Note that as increases, the ratio  also increases. When =1, the ratio equals 1.
In the article’s example, a study using 40 subjects follows the four-period design with one placebo, while another study uses 30 subjects in a five-period design with two placebo periods. To compare estimate precision between designs, considering treatment correlation, the standard error ratio is:
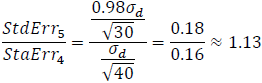
Clearly, the five-period design comes at a cost – specifically, a 13% increase in the standard error, indicating a loss in statistical precision compared to the four-period design.
Let’s calculate the sample size required for the comparison between the test drug, T, and P, using a test margin of 10. Under the assumption that all individual tests in the Intersection and Union Test (IUT) are mutually independent [2] the sample sizes required for the paired t test for the four-period design and the five-period design for this comparison are:
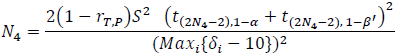
and
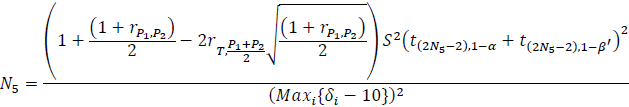
respectively, where
- S2 is the variance estimator for the common within subject variability,
- δi is the observed mean QTc prolongation at time point i, i=1,2, …, L, and L is the number of time points, and
- β'=1–
 , where β is the type II error rate of the test at each time point.
Table 1 [Tab. 1] compares the sample size and cost between the four-period and five-period study designs. The estimated maximum mean differences and standard deviations are from Darpo et al. [3]. Sample sizes were calculated using SAS 9.4, employing the paired t-test method.
Table 1: Cost comparison between four-period and five-period designs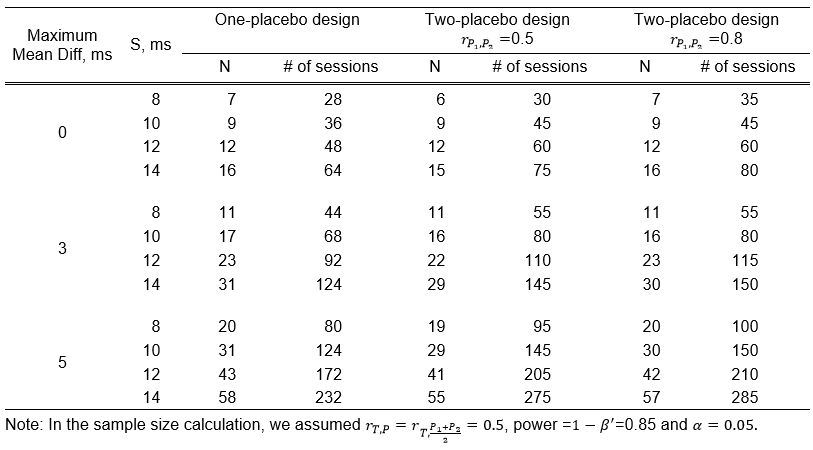
Conclusion
Ring et al.’s [1] five-period crossover TQT design offers potential cost savings through reduced sample size, assuming uncorrelated treatments. However, this assumption is unrealistic since crossover designs involve correlated measurements. Under realistic correlations, variance reduction is minimal, diminishing the sample size advantage.
Our analysis shows the five-period design can increase standard errors up to 13%, reducing statistical precision versus the four-period design. Since sample size reduction is minimal, drug exposure benefits are also limited. Efficiency gains depend heavily on treatment correlation. Using Ring et al.’s [1] efficiency definition, the four-period design proves more efficient in practice.
Notes
Competing interests
The authors declare that they have no competing interests.
References
[1] Ring A, Walter B, Larbalestier A, Chanter D. An efficient crossover design for thorough QT studies. GMS Med Inform Biom Epidemiol. 2010;6(1):Doc05. DOI: 10.3205/mibe000105[2] Tsong Y, Sun A, Kang SH. Sample size of thorough QTc clinical trial adjusted for multiple comparisons. J Biopharm Stat. 2013;23(1):57-72. DOI: 10.1080/10543406.2013.735763
[3] Darpo B, Nebout T, Sager PT. Clinical evaluation of QT/QTc prolongation and proarrhythmic potential for nonantiarrhythmic drugs: the International Conference on Harmonization of Technical Requirements for Registration of Pharmaceuticals for Human Use E14 guideline. J Clin Pharmacol. 2006 May;46(5):498-507. DOI: 10.1177/0091270006286436