[Wahrnehmungsschwellen von Veränderungen im Frequenzgang]
Kristin Ohlmann 1Birger Kollmeier 1
1 Medical Physics, Carl von Ossietzky University Oldenburg, Germany
Zusammenfassung
Anpassungen des Frequenzgangs an die Präferenz eines Zuhörers haben eine Reihe von Anwendungen, wie das Anpassen eines Equalizers für individualisierte Musikwiedergabe in Hearables oder das Feintuning von frequenzabhängiger Verstärkung in der Hörgeräteanpassung. Eine konsistente Präferenz des Zuhörers erfordert eine klare Unterscheidbarkeit der präsentierten Optionen.
Diese Studie untersucht, wie viel Verstärkung in einzelnen Frequenzbändern notwendig ist, um eine Unterscheidbarkeit zu gewährleisten. Die resultierenden Wahrnehmungsschwellen werden für verschiedene Frequenzbänder und Stimuli betrachtet.
Schwellen (d’=1,24) liegen für die meisten Konditionen im Median zwischen 3,5 und 7,3 dB. Für einen Rausch-Stimulus zeigen sich eine Tendenz zu höheren Schwellen bei niedrigen Frequenzen und wenig Unterschied zwischen positiven und negativen Verstärkungswerten. Für einen Satz-Stimulus zeigt sich für positive Verstärkungen eine Tendenz zu höheren Schwellen bei höheren Frequenzen, während Schwellen für negative Verstärkungen sich nicht-monoton verhalten. Für ein einzelnes Wort als Stimulus ergeben sich deutlich höhere Schwellen als für einen ganzen Satz (>9,5 dB).
1 Introduction
Subjective preferences of a listener are used to find appropriate frequency-dependent gain settings for a device or an application in a variety of scenarios. This includes for example adjusting equalization settings in consumer hardware, fine-tuning a hearing-aid fitting, or hearing-related research studies. A listener may be presented with pairs of different stimulus-versions, between which they have to choose their preferred one [1], [2], or they may be in control of gains in different frequency bands themselves [2], [3], [4].
For the adjusted preference to have meaning, the presented differences must be large enough such that the listener can develop a stable preference. This requires listeners to be able to consistently differentiate between the available options. However, this seems to not always be considered in the study design.
Steering equalization of gain curve adjustments requires the listener to not only perceive an added peak (e.g., based on level changes), but to differentiate between different frequency responses independent from the introduced changes to the overall level. This ability to detect changes to the spectral profile has been analyzed by Green [5], who measured detection thresholds for relative level changes to one sinusoidal tone within a tone complex. Changes between approximately 1 and 4 dB could be detected, depending on number and density of the sinusoidal background components. However, their study is limited to the artificial case of discrete frequency components with changes at a single frequency.
Discrimination of band-limited changes in broadband noise has been analyzed by Moore et al. [6], who showed that narrowband peaks (up to 0.7 octaves wide) can be detected from approximately 1–2 dB in some conditions. But frequency bands adapted in the context of equalization are usually wider. Caswell-Midwinter & Whitmer [7], [8] have analyzed the noticeability of gain changes in octave-width and dual-octave-width frequency bands in the context of hearing-aid fine-tuning. In a same-different-task targeting the just noticeable difference (JND), they found thresholds of 2.8–4.5 dB in speech-shaped noise, and thresholds of 3.7–9.6 dB in speech. However, these studies did not account for the introduced changes to the overall level explicitly.
In addition to discrimination of gain increments, frequency response adjustments also require discrimination of gain decrements. The effect of using gain decrements rather than gain increments varies between the different paradigms: Notches in broadband stimuli yield much higher thresholds (7–10 dB) compared to peaks (1–3 dB) [6]. At the same time, profile analysis thresholds for gain decrements (4–6 dB) and increments (3–6 dB) are rather similar [9]. It is not clear how detection of gain decrements behaves for changes to a wide frequency range when no level cues are available.
Therefore, this study assesses the noticeability of both gain increments and decrements to the frequency response of a filter. Changes to the broadband level were compensated to minimize the participants’ ability to detect changes based on overall level changes. Perception thresholds for filter changes were measured at different frequencies as well as in different stimuli.
2 Methods
Perception thresholds were measured in a 3-alternative-forced-choice (AFC) experiment using the AFC-framework by Ewert [10]. Each trial consisted of three presentations of the same stimulus. For one of those presentations, a gain increment or decrement was introduced in exactly one frequency band (see Figure 1 [Fig. 1]). This was achieved by filtering the stimuli with self-similar, two-octave-wide filters as proposed by Abel & Berners [11]. Filters were centered around 150 Hz, 600 Hz and 4,800 Hz. Stimuli were normalized after filtering to minimize the risk that participants perceive the filtering due to a change in overall level (instead of a change in spectral shape as intended).
Figure 1: Exemplary filters as compared by the participants. The reference filter introduced no gain, while the test filter introduced a variable gain change (here: 5 dB increment) at a specified frequency (here: 600 Hz). 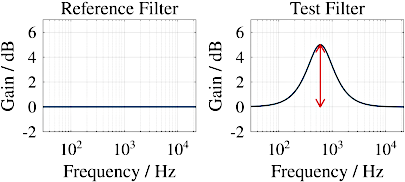
Three different stimuli were chosen: (1) A sentence from the German matrix sentence test (German: Oldenburger Satztest) OLSA [12], because speech is a relevant signal in real-world applications. (2) A single word cut from an OLSA-sentence [12] as a shorter speech stimulus, because participants in the pilot study noted that the length of the sentence stimulus impeded a direct comparison between corresponding parts of the sentence. (3) A frozen white noise stimulus, because good discrimination of spectral changes is usually expected in stationary broadband signals. Speech and noise stimuli were presented at 65 and 60 dB SPL, respectively.
The experiment started with a short training, consisting of a measurement of two exemplary conditions (noise, gain increment at 600 Hz; sentence, gain decrement at 4,800 Hz). During the training, participants received feedback after each response indicating whether they had identified the correct interval. Afterwards, two measurements were performed in random order:
- Adaptive measurement of thresholds (1-up-2-down procedure → 70% correct responses or d’=1.24): A step-size of 1 dB was used in the measurement phase. Gains were introduced at each of the frequencies for sentence and noise stimuli, and at 600 Hz for the word stimulus. One condition (sentence; gain at 600 Hz) was also measured without level normalization to estimate the effect of level cues. Conditions were presented in a random order.
- Measurement of psychometric functions: For one condition (noise; gain at 600 Hz), ten gains between –20 and 10 dB were presented ten times each in a random order.
Nine participants (audiometric thresholds ≤25 dB HL; 6 female, 3 male; aged 25.8±2.3) participated in this experiment. One participant could not reliably perform the task, with thresholds being identified as outliers in 5 out of 16 conditions (showing deviations up to 7.4 · IQR), and was therefore excluded. All participants provided written informed consent. The total duration of a measurement appointment was between 75–90 minutes.
3 Results
3.1 Effect of stimulus and frequency
Figure 2 [Fig. 2] shows measured thresholds for each condition and participant (points) and summarized across participants (boxplots). Subplots group conditions where gains were introduced at the same frequency. Colors indicate different stimuli. Filled and empty boxplots show data for conditions introducing gain increments and decrements, respectively.
Figure 2: Measured thresholds of transfer function changes in a certain band presented as boxplots (whiskers span points within 1.5× the interquartile range (IQR)) and swarmcharts. Filled and unfilled boxplots denote gain increments and decrements. Colors denote stimuli. Brackets mark significant differences.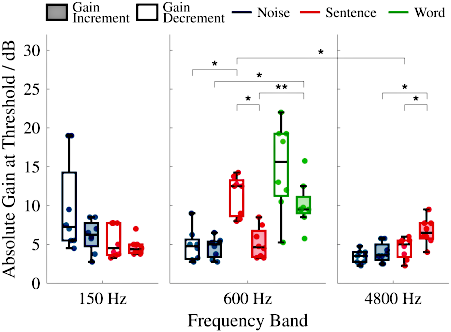
For most conditions, median thresholds are between 3.5 dB and 7.3 dB, with the exception of the word-stimulus and gain decrements introduced to the sentence-stimulus at 600 Hz. For the noise stimulus, thresholds tend to be lower for gain changes at high frequencies than for those at low frequencies. Differences between thresholds for gain increments and decrements are small, with median differences below 1 dB. For the speech stimulus, thresholds for gain increments and decrements show different frequency dependencies. Thresholds tend to increase with increasing frequencies for gain increments, but thresholds are highest in the middle frequency band (600 Hz) for gain decrements. For the word-stimulus, thresholds are considerably higher than for the corresponding measurements for sentence- and noise stimuli. Similar to the sentence-stimulus at 600 Hz, gain decrements yield considerably higher thresholds than gain increments.
A linear mixed-effects model was fitted to the data and an ANOVA was used to confirm the existence of a significant three-way-interaction (F(2.91)=6.87, p=0.002). Post-hoc t-tests with Bonferroni correction were conducted, comparing only conditions that differed in one of the three factors. Significant comparisons are noted in Figure 2 [Fig. 2] as brackets.
3.2 Effect of level cues
Figure 3 [Fig. 3] shows the measured thresholds (sentence stimulus, gain at 600 Hz) both with level normalization (right subplot; as seen in Figure 2 [Fig. 2]) and without (left subplot).
Figure 3: Measured thresholds without (left) and with (right) level normalization for the speech stimulus with gain applied at 600 Hz. Symbols and coloring are the same as in Figure 2. 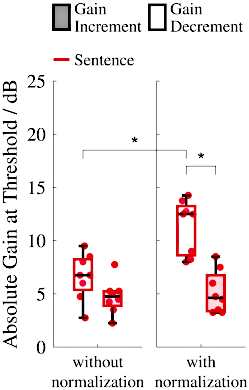
For gain increments (filled boxplots), median thresholds around 5 dB can be seen, regardless of level cues. Gain decrements tend to yield higher thresholds, especially when level cues are suppressed (with level cues: 6.75 dB, without level cues: 12.5 dB).
A statistical analysis was performed by fitting a linear mixed-effects model and analyzing that model using an ANOVA. The analysis reveals a significant interaction between gain direction and normalization (F(1.14)=14.252, p=0.002). Post-hoc t-tests with Bonferroni correction reveal a significant effect of level cues for gain decrements, as well as a significant difference between thresholds for gain increments and decrements when level cues are suppressed.
4 Discussion
In this study, perception thresholds and psychometric functions for changes of gain in an individual two-octave-wide frequency band were measured. A similar study has been made by Caswell-Midwinter & Whitmer, who measured JNDs for gain changes in octave- and two-octave-bands centered around 0.25, 1, and 4 kHz in speech [8], as well as in octave-bands in speech-shaped noise [7]. An immediate comparison of the results needs to be approached with caution: First, the change in overall level was compensated in the present study, which Caswell-Midwinter & Whitmer did not do. But an exemplary measurement (see Sec. 3.2) shows no effect of level cue compensation for gain increments. Second, the threshold definition by Caswell-Midwinter & Whitmer (d’=1) differed from that in the present study (d’=1.24). However, based on an exemplarily measured psychometric function (see Figure 4 [Fig. 4]), deviations caused by this difference are around 0.5 dB, which can be considered negligible. For gain increments, it is therefore assumed that the studies are sufficiently comparable.
Figure 4: Correct response rates at different gains introduced at 600 Hz in the noise stimulus presented as boxplots. In the background, fitted Weibull functions and their 95% confidence intervals are drawn.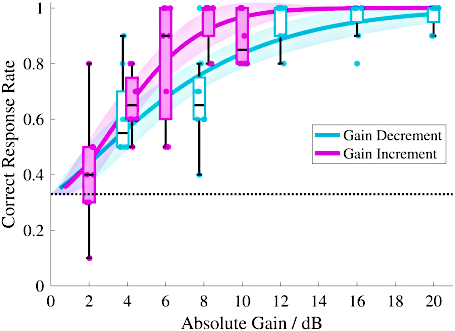
For gain increments in the sentence stimulus, thresholds between 4.4 and 6.5 dB were measured, which is in line with the results by Caswell-Midwinter & Whitmer, who found JNDs between 3.7 and 6.8 dB for dual-octave-bands [8]. Their measured JNDs were significantly higher in the highest frequency band. A similar tendency (although not significant) could be seen here.
Thresholds for the word stimulus exceed those of the sentence stimulus significantly. While informal reports from pilot-participants had suggested the duration of the sentence stimulus as a complicating factor due to limited auditory memory, this assumption cannot be confirmed by the complete data set. Instead, the increased thresholds suggest that the short word stimulus did not provide sufficient information to the listener.
Thresholds for gain increments in the noise stimulus are in a similar range as for the sentence stimulus, with median thresholds between 3.6 and 6.3 dB. In the studies by Caswell-Midwinter & Whitmer, JNDs for octave-band gain increments in speech-shaped noise (2.8 dB, [7]) were lower than for the corresponding octave-band increments in speech (6.3–9.6 dB, [8]), suggesting that gain increments are more easily perceivable in stationary compared to spectrotemporally modulated stimuli. This effect cannot be observed between sentence and white noise stimuli in the present study, suggesting that the different energy distribution in the white noise has a detrimental effect on discrimination ability, which is counteracting the effect of stationarity. Energy in white noise is more widely distributed, such that more energetically-relevant distracting frequency bands exist.
The discrimination of changes in spectrum without access to level cues is referred to as profile analysis. Experiments usually assess discrimination of changes in one of multiple sinusoidal components in a tone complex. For a tone complex with densely spaced components, thresholds are around a 3 dB increment of the target component [5], which is close to the lowest thresholds measured here. Thresholds increase by about 2 dB when the target signal moves towards the edges of the tone complex [5], which fits together with results from the present study, where thresholds in speech increase towards the upper end of the speech frequency range. While the stimuli and increments used in this study differ from the classic profile analysis experiments, the similarity in thresholds and parameter dependency suggests that similar perceptual mechanisms are relevant. Relative changes of the gains are likely compared over a wide frequency range, rather than focusing on absolute changes in adjacent components.
Relative to thresholds for level increments, thresholds for decrements are higher by about 6 dB for detection of notches (with level cues) [6], and by about 1–2 dB in profile analysis tasks [9]. In the present study, no consistent effect of gain decrements relative to gain increments could be observed. In the noise stimulus, thresholds for gain decrements are very similar to those for gain increments with deviations up to 1 dB. This is in a similar range as the effect observed for profile analysis thresholds. In the speech stimulus, gain decrements are sometimes harder (600 Hz) and sometimes easier (4,800 Hz) to perceive than gain increments. It needs to be noted that a difference between increments and decrements were not found when level cues remained intact (in the exemplary condition measured with and without normalization; see Figure 3 [Fig. 3]). It therefore seems possible that the observed effects of gain decrements are a consequence of the introduced level normalization.
Caswell-Midwinter & Whitmer were unable to measure thresholds for gain decrements relative to the baseline frequency response, due to issues with the procedure not converging or yielding large errors for many participants [7]. That thresholds for gain decrements could be measured in the present study is likely a result of the level normalization. Perceivable cues are dominated by the relative gain change between neighboring frequency bands, which is the same for gain increments and decrements, rather than absolute changes. This idea is supported by the fact that thresholds for gain decrements in profile analysis are barely higher than those for gain increments [9].
5 Conclusion
In this study, perception thresholds for frequency-band-specific gain changes were measured in normal-hearing participants. Median thresholds for gain increments are in the range between 3.5 and 6.5 dB for most conditions and depend on stimulus and frequency band in a non-trivial way.
Thresholds seen in the sentence stimulus are consistent with results from Caswell-Midwinter & Whitmer [8]. Thresholds for the white noise stimulus have no immediate equivalent in literature. They are larger than thresholds seen by Caswell-Midwinter & Whitmer in speech-shaped noise, likely due to a less beneficial energy distribution. The single-word stimulus yields substantially larger thresholds, suggesting that participants could not extract sufficient information from this shorter speech stimulus.
Gain increments and decrements yield different thresholds only in the speech stimuli, which may be related to the applied normalization of presentation levels.
For many conditions, thresholds and their dependencies show similarities to those seen for profile detection experiments, suggesting similar perceptual mechanisms are at play (i.e., comparing gains across a wide frequency range, rather than focusing on global or local absolute changes).
Notes
Conference presentation
This contribution was presented at the 28th Annual Conference of the German Society of Audiology and published as an abstract [13].
Funding
This work was supported by the German Research Foundation (Deutsche Forschungsgemeinschaft, DFG), Project ID No. 352015383 (SFB 1330 HAPPAA A4).
Ethics statement
This study was approved by the Medical Ethics Committee of the Carl von Ossietzky University Oldenburg (Approval No. 2021-131). All participants provided written informed consent prior to enrollment in the study.
Competing interests
The authors declare that they have no competing interests.
References
[1] Amlani AM, Schafer EC. Application of paired-comparison methods to hearing AIDS. Trends Amplif. 2009 Dec;13(4):241-59. DOI: 10.1177/1084713809352908[2] Dirks DD, Ahlstrom J, Noffsinger PD. Preferred frequency response for two- and three-channel amplification systems. J Rehabil Res Dev. 1993;30(3):305-17.
[3] Vaisberg JM, Beaulac S, Glista D, Macpherson EA, Scollie SD. Perceived Sound Quality Dimensions Influencing Frequency-Gain Shaping Preferences for Hearing Aid-Amplified Speech and Music. Trends Hear. 2021 Jan-Dec;25:2331216521989900. DOI: 10.1177/2331216521989900
[4] Kursun B, Shola C, Cunio IE, Langley L, Shen Y. Variability of Preference-Based Adjustments on Hearing Aid Frequency-Gain Response. J Speech Lang Hear Res. 2025 Apr 8;68(4):2006-25. DOI: 10.1044/2024_JSLHR-24-00215
[5] Green DM. Profile Analysis - Auditory Intensity Discrimination. New York: Oxford University Press; 1988.
[6] Moore BC, Oldfield SR, Dooley GJ. Detection and discrimination of spectral peaks and notches at 1 and 8 kHz. J Acoust Soc Am. 1989 Feb;85(2):820-36. DOI: 10.1121/1.397554
[7] Caswell-Midwinter B, Whitmer WM. Discrimination of Gain Increments in Speech-Shaped Noises. Trends Hear. 2019 Jan-Dec;23:2331216518820220. DOI: 10.1177/2331216518820220
[8] Caswell-Midwinter B, Whitmer WM. Discrimination of Gain Increments in Speech. Trends Hear. 2019 Jan-Dec;23:2331216519886684. DOI: 10.1177/2331216519886684
[9] Ellermeier W. Detectability of increments and decrements in spectral profiles. J Acoust Soc Am. 1996;99:3119-25.
[10] Ewert SD. AFC - A modular framework for running psychoacoustic experiments and computational perception models. In: Proceedings of the International Conference on Acoustics AIA-DAGA 2013, Merano, Italy. Berlin: DEGA; 2013. p. 1326-9.
[11] Abel JS, Berners DP. Filter Design Using Second-Order Peaking and Shelving Sections. In: Proceedings of the ICMC. San Francisco: ICMC; 2004.
[12] Wagener KC, Kühnel V, Kollmeier B. Entwicklung und Evaluation eines Satztests für die deutsche Sprache I: Design des Oldenburger Satztests. Zeitschrift für Audiologie. 1999;38(1):4-15.
[13] Ohlmann K, Kollmeier B. Unerwartet schlechte Wahrnehmbarkeit von Veränderungen im Frequenzgang. In: Deutsche Gesellschaft für Audiologie e. V., editor. 28. Jahrestagung der Deutschen Gesellschaft für Audiologie. Oldenburg, 04.-06.03.2026. Düsseldorf: German Medical Science GMS Publishing House; 2026. Doc109. DOI: 10.3205/26dga109