Explorative data science analysis of the Universal Newborn Hearing Screening in Schleswig-Holstein (2004–2024)
Tobias Pötzl 1,2Siegrid Meier 1,3
Rainer Schönweiler 1,4
Karl-Ludwig Bruchhage 1,2
1 University of Luebeck, Clinic for Ear, Nose and Throat Medicine, Phoniatrics and Pediatric Audiology, Luebeck, Germany
2 University Medical Centre Schleswig-Holstein, Campus Luebeck, Germany
3 Earlinks Consulting for Audiology + Elearning + Gaming, Krummesse, Germany
4 Practice of Dr. med. Kissing-Roskothen, Reinbek, Germany
Abstract
Question: What insights can be gained from the long-term data of the Universal Newborn Hearing Screening in Schleswig-Holstein and how can modern data science methods be used to analyse and visualize these data?
Methods: This study is based on a retrospective analysis of screening data collected in over 20 clinics and 50 practices in Schleswig-Holstein between 2004 and 2024. The analysis of these data, which included both initial and re-screening results, aimed to evaluate participation rates and diagnostic trends in newborn hearing screening. Comprehensive data cleaning was required due to various factors. Exploratory statistical methods and data science techniques such as vectorization, embedding and t-SNE (t-distributed Stochastic Neighbour Embedding) were used for the analysis.
Results: Analysis of the screening data showed that the number of clinics involved in reporting varied over the years. There were differences in the number of screenings performed directly in the clinics. The number of control screenings were higher in 2015 and 2016. The total number of diagnosed cases of hearing impairment corresponded to the expected prevalence. The number of documented hearing aid fittings varied widely and there was a significant under-reporting of cochlear implant fittings. Natural Language Processing (NLP) was used to extract and visualize additional information from the free text field “History”, which provided new insights into the data.
Conclusions: The application of data science methods to the collected data of the universal newborn hearing screening in Schleswig-Holstein provided valuable insights. The results highlight the potential for the development of specific intervention strategies. Recording the date of birth as well as training for the screening staff and improving the completeness of the data sets are important factors for future analyses.
Keywords
newborn hearing screening, data analysis, data science, prevalence, screening quality, data cleansing, machine learning
Introduction
Congenital hearing impairment is one of the most common congenital disorders. The international prevalence of bilateral, clinically significant hearing impairment is approximately 1 to 2 per 1,000 newborns [1], [2], [3]. Without a universal newborn hearing screening (UNHS), such a hearing impairment is often not diagnosed until the age of two to three years. This late detection can lead to significant and partially irreversible delays in linguistic, cognitive, and socio-emotional development. Therefore, early identification through comprehensive screening and subsequent intervention within the first six months of life are crucial in enabling age-appropriate development for affected children. This underscores the high public health relevance of the program examined in this study.
Against this backdrop, the Universal Newborn Hearing Screening (UNHS) was implemented in Schleswig-Holstein in 2002, marking one of the earliest adoptions of this initiative in Germany [4]. The Hearing Screening Centre Schleswig-Holstein was established at the University Medical Centre Schleswig-Holstein (UKSH), Campus Lübeck. This pioneering work by Prof. Dr. med. Rainer Schönweiler was multifaceted. This included the development of a software package for the reporting sites and the Centre itself, as well as the clarification of data protection issues. He also organized the financing of missing screening devices and the training of on-site screeners. He handled a political mandate from the responsible ministry and the Association of Statutory Health Insurance Physicians (KVSH). Also, he founded a sponsoring association, since there was no financing of all these components at the time. From 2008 to early 2012 the Hearing Screening Centre Schleswig-Holstein also conducted hearing screenings in Hamburg. The UNHS-SH was initially financed by donations, for example from the Bluhme-Jebsen Foundation, and has been covered by the health insurance funds as a special task under the Hospital Act since 2019. Since December 2003, screening has been conducted on a nationwide basis with approximately 23,000 newborns in Schleswig-Holstein undergoing screening annually [5], [6]. The screening process includes documenting the results in the children’s check-up booklet and transmitting the data, including a screening number, to the Hearing Screening Centre via the Internet, e-mail, fax, or letter. A database software developed for this purpose enables the automated detection of outstanding exams. If necessary, the parents will be informed in writing or by telephone [7].
Since October 2024, the responsibility for the UNHS-SH has fallen under the supervision of Prof. Dr. med. Karl-Ludwig Bruchhage, who serves as the Director of the clinic of Otorhinolaryngology, Phoniatrics and Pediatric Audiology at the UKSH, Lübeck. The extensive screening data collected over the past two decades now offers the possibility of a retrospective analysis. By applying modern data analysis techniques, the quality of the screening, the prevalence of hearing disorders and potential for optimization will be evaluated. Furthermore, the structural and technical adjustments necessary to enhance the accuracy and informative value of the data in long term will be investigated [8], [9], [10].
Methods
This study was based on screening data collected in over 20 clinics and 50 practices in Schleswig-Holstein between 2004 and 2024. The analysis of this data, which included both initial and follow-up screening results, aimed to evaluate participation rates and diagnostic trends in newborn hearing screening. One of the key challenges in analysing this large amount of data was the need for comprehensive data cleaning. Multiple factors, such as data protection restrictions that limited the recording of the date of birth to conspicuous cases, as well as the involvement of many people entering data over time led to typing errors and field mix-ups. In addition, duplicates occurred in the form of identical children with different child IDs and vice versa. In order to achieve valid and reliable results, a multi-stage data cleansing process was therefore essential (Figure 1 [Fig. 1]). Initially, two primary databases were merged: an older Access database (2004–2019) comprising 312,996 entries and a more recent database (2017–2025) with 120,608 entries. It should be noted that these time periods partially overlap. Subsequently, data records from Hamburg that had been recorded at the Schleswig-Holstein Hearing Screening Centre between 2008 and the beginning of 2012 were removed. In addition, invalid entries were removed, such as test data, implausible entries and data records that fell outside the designated study period (2004–2024) or had an entry date that occurred more than 180 days after or before birth. These measures enabled the creation of a final, refined data set comprising 331,275 entries. After the cleansing of the data, the inconsistent nomenclature for screening results was standardized. Missing values, particularly for initial screening, re-screening, and follow-up, were partially reconstructed from the unstructured comment field “History” using feature engineering. For the actual analysis, exploratory statistical methods and machine learning techniques were used to identify patterns and analyse trends in the screening process.
Figure 1: Data cleansing process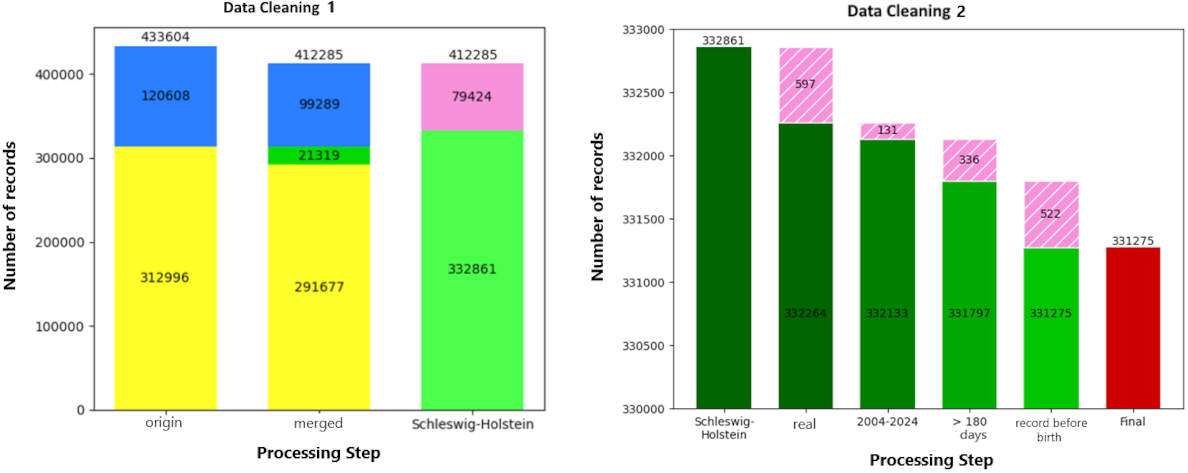
Results
The analysis of screening data from 2004 to 2024 shows that the number of clinics involved in reporting newborn hearing screening in Schleswig-Holstein varied over the years and included more than 30 maternity clinics, including very small facilities and those that have since closed. At the time of the analysis approximately 20 clinics were providing screening data. According to the guidelines of the Federal Joint Committee (G-BA), ideally 95% of newborns should be screened directly in the maternity clinic ([11], p. 62-6). The chart titled “Clinics by Number of Screenings” (Figure 2 [Fig. 2]) shows the total number of children screened in each clinic with dark blue bars, while the light blue bars indicate the number of screenings recorded directly in the maternity clinic. It is noticeable that for some clinics, such as the clinic with the identifier K010, there is a discrepancy between the number of children recorded and the number of screenings carried out directly in the clinic. This can be explained by the fact that such clinics did not enter the screening data directly into the system, but sent it by fax to the Centre, where the data was then entered manually into the database. This approach made it difficult to accurately record the number of screenings actually carried out in the clinics, as the tracking software did not explicitly support this distinction.
Figure 2: Clinics by number of screenings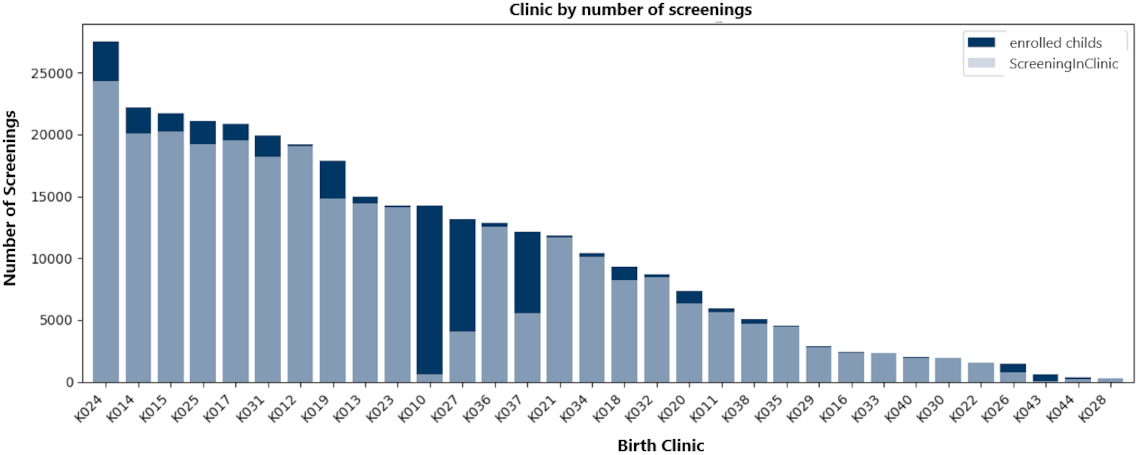
As illustrated in the top chart of Figure 3 [Fig. 3] “Primary and control screenings per year (2004–2024)”, the majority of newborns were ideally normal at the time of their first visit. However, the graph reveals that a higher number of control screenings (re-screenings) were conducted in 2015 and 2016. This phenomenon is even more evident in the percentage representation (Figure 3 [Fig. 3], centre). Specifically, in 2015 and 2016, control screenings constituted 13% and 11% of all screenings performed, respectively. The chart broken down by hospital (Figure 3 [Fig. 3], bottom) shows that a significant proportion of follow-up screenings originated from the largest clinic (K024). However, this retrospective analysis was unable to definitively ascertain whether the observed increase in control screenings was attributable to systematic input errors in documentation or to actual issues with screening measurements at this facility during the specified period.
Figure 3: Primary and control screenings per year (2004–2024)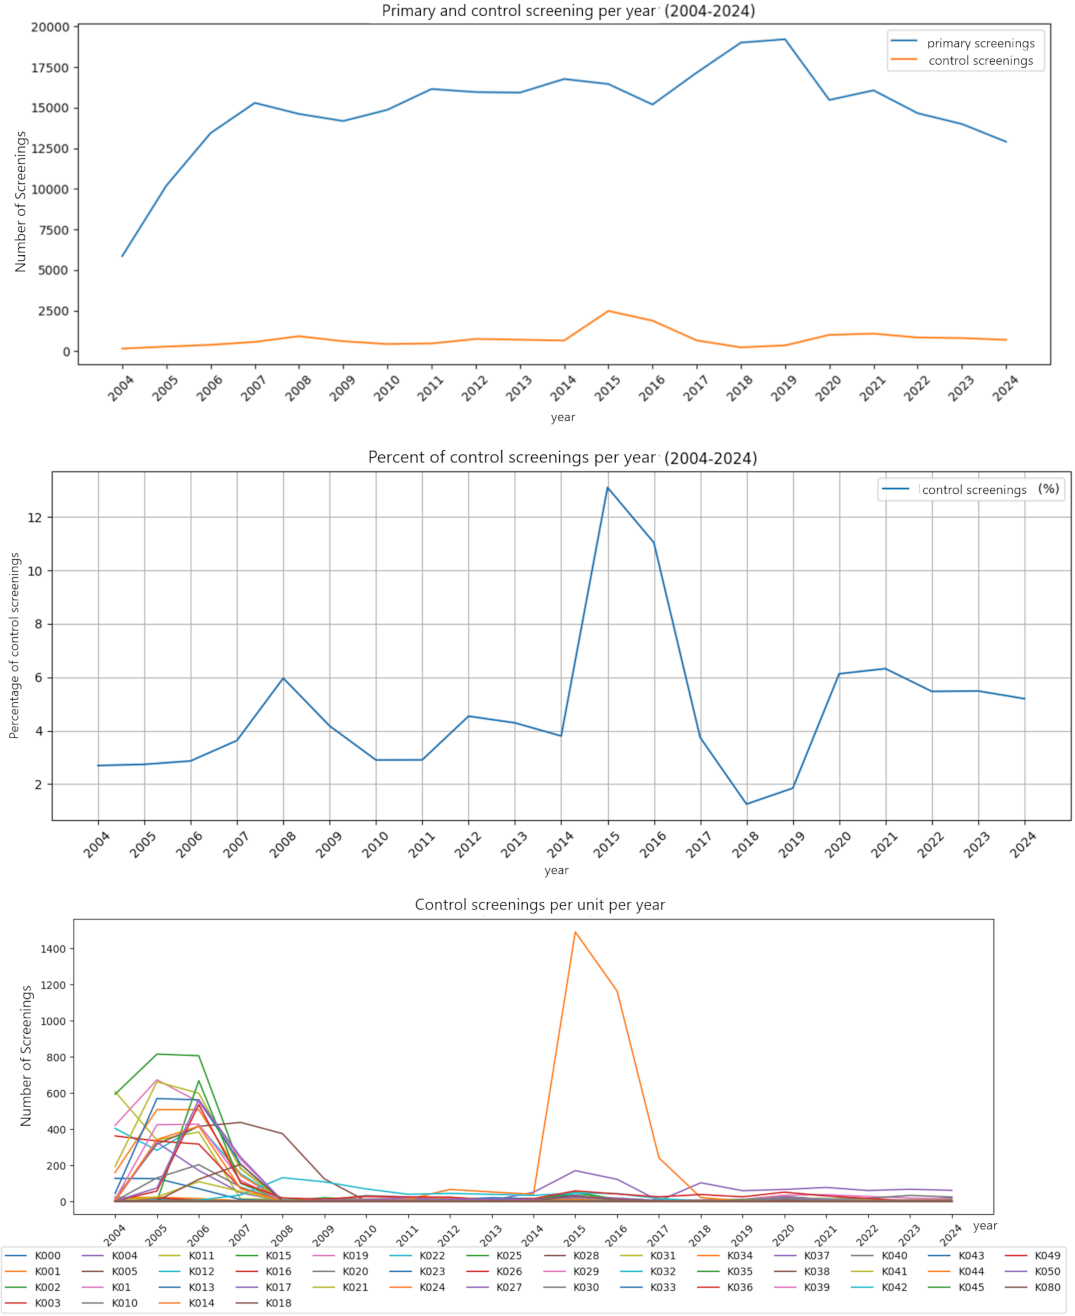
The proportion of subjects who underwent subsequent evaluation (Figure 4 [Fig. 4], top) over the years indicates that the proportion of children with a confirmatory diagnosis remained within the range of ≤4% recommended by the G-BA ([11], p. 62-6). However, fluctuations in the data were observed over time, which merit further investigation. The aggregate number of diagnosed cases of hearing impairment, encompassing varying degrees of severity, corresponded to the prevalence in the literature of approximately 1–2 cases per 1,000 newborns [1], [2], [3]. Starting in 2015, a shift in the distribution of severity was observed, with bilateral moderate hearing loss being the most common form of diagnosed hearing impairment. This increase signalled an alteration in the spectrum of hearing loss severity, though the underlying causes could not be definitively elucidated in this exploratory analysis.
Figure 4: Follow-up, prevalence, hearing aid care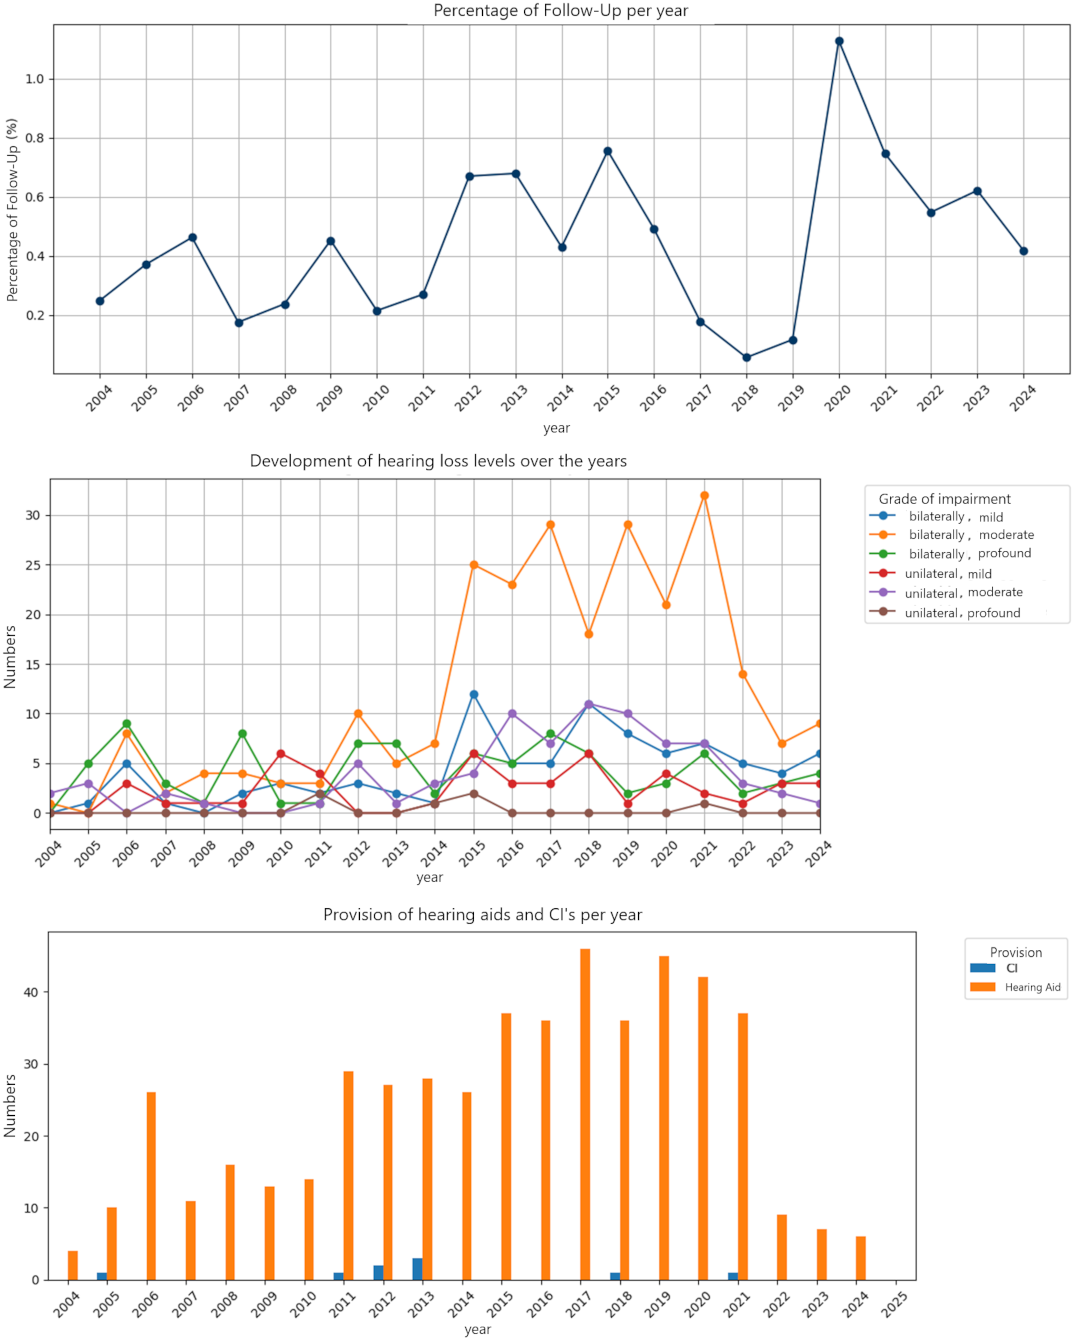
The number of hearing aid fittings documented in the data base fluctuated considerably and fell short of expectations. This apparent underreporting was noticed by the UNHS-SH monitoring team during the data collection period. Therefore, the actual data on fittings were collected manually via telephone or in writing from specialists and clinics, since the intended electronic reporting by users was not performed as planned. The inadequacy of the purely electronic data collection is particularly evident in the case of cochlear implants, of which only nine fittings were recorded in the system over the entire period [3]. This discrepancy between the system’s records and the manually collected data confirms the challenges in achieving a complete digital follow-up of children through to the final intervention stage.
Since the structured data fields did not always contain all relevant information, while the free text field “History” had detailed logging, this was analysed using Natural Language Processing (NLP). For this purpose, word embeddings were generated using BERT (Bidirectional Encoder Representations from Transformers, a local model developed by Google). These embeddings are high-dimensional vectors that were visualized as points in a reduced dimension using t-SNE (t-distributed stochastic neighbour embeddings). In this representation, the spatial proximity of the points represents the semantic similarity of the underlying text information.
The initial visualization (see Figure 5 [Fig. 5], top left) illustrates the distribution of data points, with the colour coding denoting the affiliation to the various facilities (clinics). This visualization reveals initial cluster formations indicative of similarities in the information documented by the respective clinics.
Figure 5: t-SNE visualization of the BERT embeddings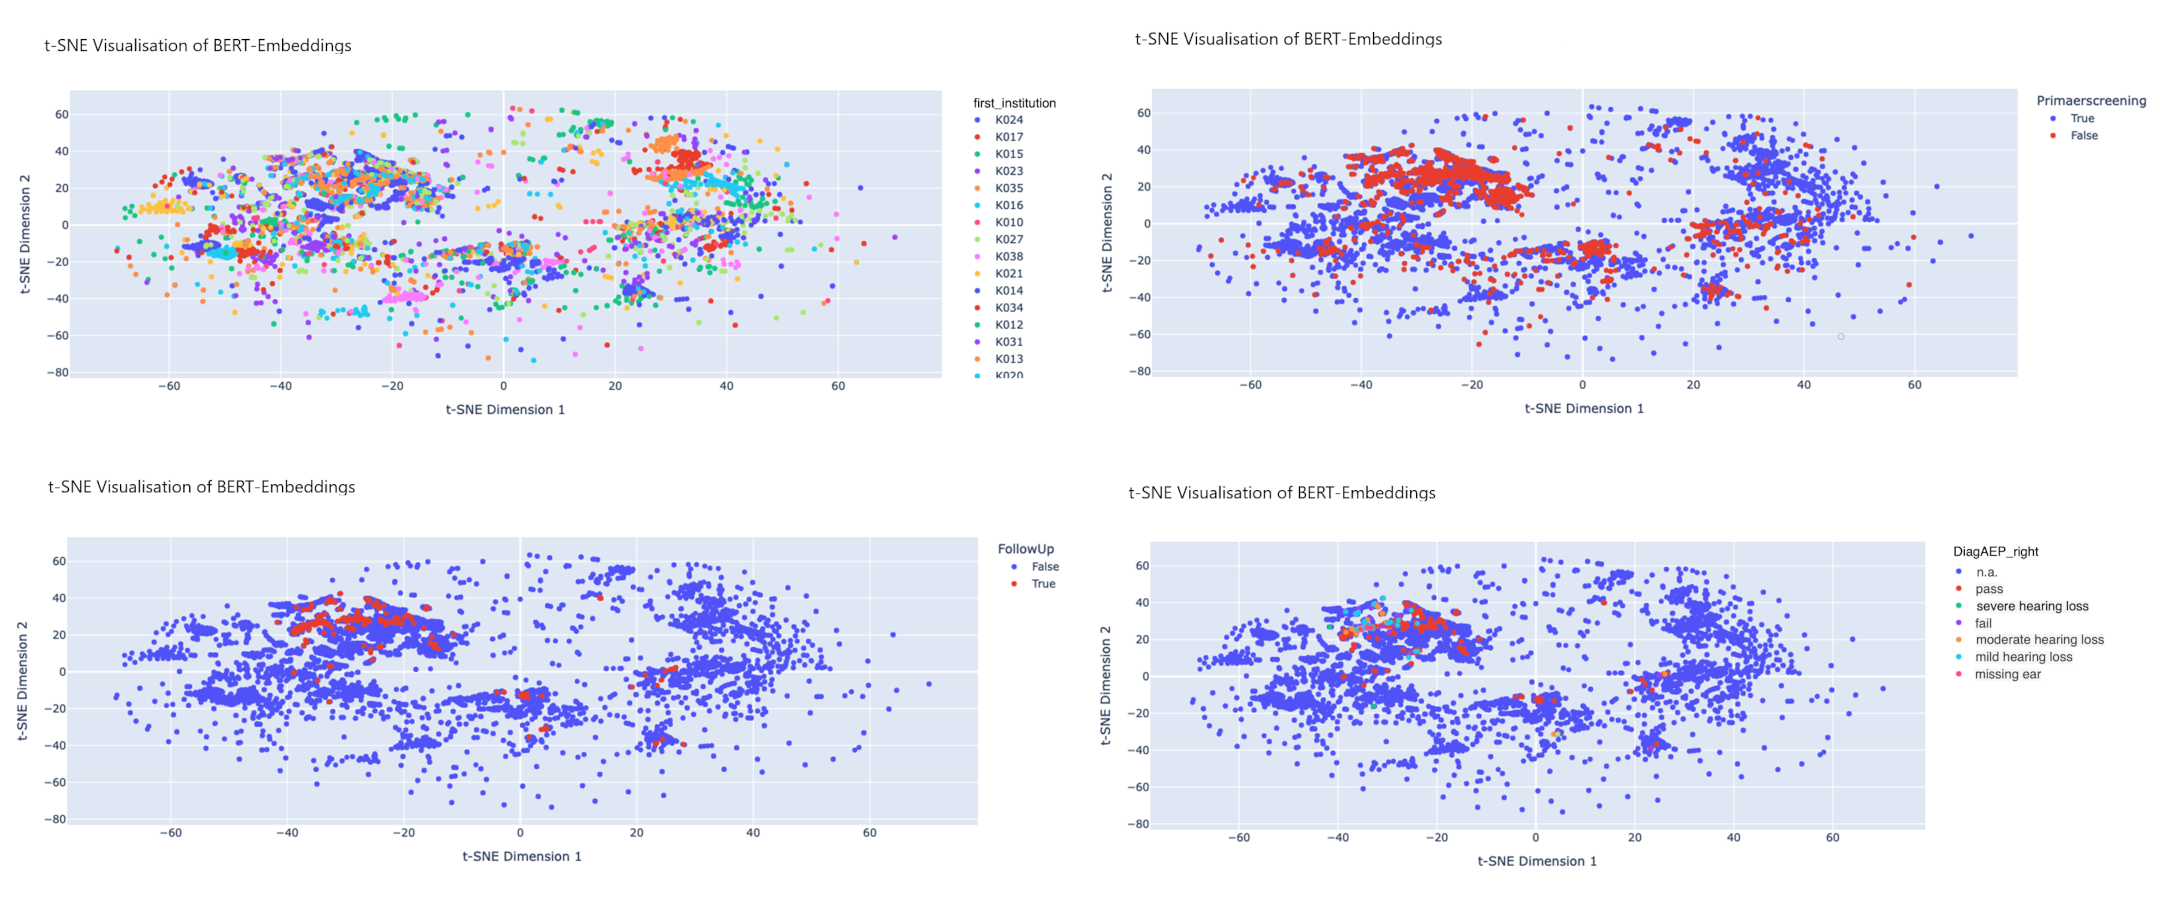
Another visualisation (see Figure 5 [Fig. 5], top right) highlights the “Primary Screening” data field. In this representation, red dots signify cases requiring control screening. An accumulation of these red dots in specific clusters suggests the potential presence of shared factors contributing to a higher rate of control screening in the associated facilities.
Similar patterns were also observed when examining follow-up examinations (see Figure 5 [Fig. 5], bottom left) and the distribution of severity of hearing impairment (see Figure 5 [Fig. 5], bottom right) within the visualised data points. These initial results of NLP-based analysis demonstrate the potential of this method for exploratory data analysis and for identifying patterns that may remain hidden in traditional structured data.
Summary and conclusion
The underreporting of intervention data, as shown in the results, is a significant limitation that must be addressed. It is unlikely that these fluctuations correspond to an actual deficit in care. Rather, it can be assumed that they are attributable to gaps in the feedback process from the providing institutions to the screening center. A plausible explanation is that cases were administratively closed after a successful diagnosis, without the final information on the type and timing of the intervention (hearing aid or CI) being systematically reported back.
In order to close this critical data gap and map the entire chain of care, a multi-stage strategy is being pursued. Firstly, the implementation of the new software will enable proactive case management. In the future, cases will only be finally closed once explicit feedback on the intervention has been received. Automatic reminder functions and improved monitoring will allow the responsible staff to follow up on open cases more consistently with the relevant pediatric audiologists, ENT specialists, and parents and to reduce the high effort of the previous manual data backfilling.
Secondly, the collaboration with intervention partners is being specifically deepened and structured. At an internal level, the goal is to formalize the information flow between the screening center and the CI-providing facilities of the UKSH (at the Kiel and Lübeck sites). The aim is to develop a standardized reporting workflow which ensures that every CI implantation is reported back to the center promptly and completely. Externally, the long-standing collaboration with the State Support Center for Hearing (Landesförderzentrum Hören) in Schleswig is being renewed and intensified to establish a regular, bidirectional exchange on the intervention status of the children receiving follow-up care. Likewise, the cooperation with pediatric audiologists is being leveraged to increase the reporting rate for hearing aid fittings. All these measures are supported by regular training and a continuous dialogue with the personnel involved in data collection to raise awareness of the importance of complete documentation and to sustainably secure process quality.
In summary, the application of data science methods to the data collected from the universal newborn hearing screening program in Schleswig-Holstein has provided valuable and new insights. The analysis underscores the potential for the development of specific intervention strategies through further research. A pivotal element for subsequent analyses is the implementation of a novel data protection concept for the recording of birth dates. This would for example enable the investigation of the influence of time intervals between birth, initial screening, rescreening, follow-up, and diagnoses. The necessity for training screening staff and enhancing the completeness of data sets was also identified. A key lever for this is the planned introduction of a new, unified software infrastructure this year.
This new system addresses the limitations of the previous data transmission process, which became implicitly evident in our analysis. The former process was characterized by heterogeneous channels (e.g., fax, e-mail, postal mail) and resulting media disruptions, which required manual, error-prone, and time-consuming data entry at the central office. The new software will equip all screening sites with a uniform client and create a standardized, digital interface to the central office. Furthermore, future interfaces to medical device software and hospital information systems (HIS) are planned to further reduce media disruptions. Integrated plausibility and completeness checks directly at the point of data entry will significantly enhance data quality. For the central office, the new software primarily enables automated statistical monitoring at the push of a button. This will allow for the near real-time detection of deviations and data gaps, facilitating proactive responses and thereby substantially increasing the efficiency and safety of the entire tracking process.
Our analysis demonstrates that data science methodologies offer novel insights and have the potential to enhance the efficiency of the newborn hearing screening program in the future.
Notes
Conference presentation
This contribution was presented at the 27th Annual Conference of the German Society of Audiology and published as an abstract [12].
Competing interests
The authors declare that they have no competing interests.
References
[1] Nennstiel-Ratzel U, Brockow I, Söhl K, Zirngibl A, am Zehnhoff-Dinnesen A, Matulat P, Mansmann U, Rieger A. Endbericht zur Evaluation des Neugeborenen-Hörscreenings 2011/2012. Im Auftrag des Gemeinsamen Bundesausschusses. 2017. Available from: https://www.g-ba.de/downloads/17-98-4329/2017-05-18_Kinder-RL_Annahme_Endbericht_NHS-Bericht.pdf[2] Ptok M. Early detection of hearing impairment in new borns and infants. Dtsch Arztebl Int. 2011;108(25):426-31. DOI: 10.3238/arztebl.2011.0426
[3] Caluraud S, Marcolla-Bouchetemblé A, de Barros A, Moreau-Lenoir F, de Sevin E, Rerolle S, Charrière E, Lecler-Scarcella V, Billet F, Obstoy MF, Amstutz-Montadert I, Marie JP, Lerosey Y. Newborn hearing screening: analysis and outcomes after 100,000 births in Upper-Normandy French region. Int J Pediatr Otorhinolaryngol. 2015;79(6):1059-63. DOI: 10.1016/j.ijporl.2015.03.012
[4] Universitätsklinikum Schleswig-Holstein. UKSH bedankt sich bei Friedrich-Bluhme-und-Else-Jebsen-Stiftung für jahrelange Unterstützung des Neugeborenen-Hörscreenings in Lübeck und Schleswig-Holstein und stellt künftige Finanzierung vor. 2018 Aug 02 [cited 2025 March 11]. Available from: https://www.uksh.de/180802_pi_neugeborenen_hoerscreening-path-13576,9874,13830,62550.html
[5] Statistisches Bundesamt (DeStatis). Lebendgeborene: Bundesländer, Monate, Geschlecht. [cited 2025 March 11]. Available from: https://www-genesis.destatis.de/genesis/online?sequenz=tabelleErgebnis&selectionname=12612-0101
[6] Schönweiler R. Leserbrief zum Beitrag von M. Gross. Laryngo-Rhino-Otol. 2006;85(2):132. DOI: 10.1055/s-2006-925072
[7] Linder R, Katalinic A, Thyen U, Schönweiler R. UNHS-SH: A multidisciplinary approach to the newborn hearing screening in Schleswig-Holstein. In: Deutsche Gesellschaft für Phoniatrie und Pädaudiologie e. V., editor. 100 Jahre Phoniatrie in Deutschland. 22. Jahrestagung der Deutschen Gesellschaft für Phoniatrie und Pädaudiologie, 24. Kongress der Union der Europäischen Phoniater. Berlin, 16.-18.09.2005. Düsseldorf: German Medical Science GMS Publishing House; 2005. Doc05dgppP06. Available from: https://www.egms.de/static/de/meetings/dgpp2005/05dgpp055.shtml
[8] Nennstiel U, Brockow I, Hanauer M, Heißenhuber A, am Zehnhoff-Dinnesen A, Matulat P, Mansmann U. Endbericht zur Folge-Evaluation des Neugeborenen-Hörscreenings 2017/2018. Im Auftrag des Gemeinsamen Bundesausschusses. 2022. Available from: https://www.g-ba.de/downloads/40-268-9045/2022-11-17_Kinder-RL_Abnahme-Endbericht-Folge-Evaluation-NHS_Bericht.pdf
[9] Schönweiler R, Schmidt CM. Universal Auditory Screening of Neonates and Hearing Disorders in Childhood. Dtsch Arztebl Int. 2009;106(20):355-6. DOI: 10.3238/arztebl.2009.0355
[10] Kugelstadt S, Wohlfarth F, Hirschfelder A, Mürbe D. Deutsches Zentralregister für kindliche Hörstörungen (DZH) – Qualitätssicherung pädaudiologischer Diagnostik. In: Deutsche Gesellschaft für Phoniatrie und Pädaudiologie e. V., editor. Phoniatrisch-pädaudiologische Aspekte 2020. sine loco [digital], 26.09.2020. Düsseldorf: German Medical Science GMS Publishing House; 2020. Doc21. DOI: 10.3205/20dgpp21
[11] Gemeinsamer Bundesausschuss (G-BA). Richtlinie des Gemeinsamen Bundesausschusses über die Früherkennung von Krankheiten bei Kindern (Kinder-Richtlinie) in der Fassung vom 18. Juni 201518. Juni 2015, zuletzt geändert am 21. März 2024, in Kraft getreten am 13. Juli 2024. Berlin: G-BA; 2024. Available from: https://www.g-ba.de/downloads/62-492-3691/Kinder-RL_2024-03-21_iK-2024-07-13.pdf
[12] Pötzl T, Schönweiler R, Meier S, Bruchhage KL. Explorative Data Science Analyse des Universellen Neugeborenen Hörscreenings in Schleswig-Holstein (2004–2024). In: Deutsche Gesellschaft für Audiologie e. V.; ADANO, editors. 27. Jahrestagung der Deutschen Gesellschaft für Audiologie und Arbeitstagung der Arbeitsgemeinschaft Deutschsprachiger Audiologen, Neurootologen und Otologen. Göttingen, 19.-21.03.2025. Düsseldorf: German Medical Science GMS Publishing House; 2025. Doc061. DOI: 10.3205/25dga061