Validation of eating duration using an automatic feeding system
Marta Terré 3
Matthieu Bouchon 4
Bruno Meunier 4
Lene Munksgaard 1
Isabelle Veissier 4
1 Aarhus University, Tjele, Denmark
2 Department of Animal Nutrition and Management; Swedish University of Agricultural Sciences (SLU); Uppsala; Sweden
3 Ruminant Production, IRTA, Caldes de Montbui, Spain
4 Université Clermont Auvergne, INRAE, Saint-Genès-Champanelle, France
Keywords
automatic feeding systems, eating time, validationIntroduction
Feed intake is important to consider when studying welfare, productivity and efficiency in ruminants, particularly cattle. Over the last decade, several methods for automatic intake recording have been developed. These methods have been described in the chapter on feed and water intake of the present book of methods [1]. Automatic feed bins do not only record feed intake, but also feeding behaviour. The duration of feed bin visits estimated by the Insentec Roughage Intake Control system (Hokofarm, Marknesse, The Netherlands) is highly correlated with that measured by direct observations [2] and with chewing time at the feed bin, recorded by noseband pressure sensors [3]. During a feed bin visit, the animal spends time eating, but may also stand without eating. Therefore, visit duration does not necessarily correspond to eating duration. To estimate eating duration from automatic feed bins which record intake, it is necessary to check that eating duration and feed bin visit duration are linked. We applied the checklist to validate sensor output for the recording of cattle behaviour presented in the present book of method [4] on data from different types of automatic feed bins used to estimate eating time. From this work we specified the procedure of validation of such measurements.
Prerequisites
The examples reported in this chapter come from Deliverable 7.2 – Test of guidelines of the SmartCow project [5]. The full set of results can be found in that deliverable. The numbers of the Animal Trait Ontology (ATOL) for livestock addressed here are: ATOL_0000363, ATOL_0000771, ATOL_0000772, ATOL_0000776, ATOL_0000777, ATOL_0000778, ATOL_0000924, ATOL_0001528 and ATOL_0005395. For more information regarding ATOL, visit https://www.atol-ontology.com/en/erter-2/.
Specifications to the checklist to use feed bin data to assess eating behaviour
A – Description of the equipment
- Describe the feed bins used (including brand, model and manufacturer) and define how a visit by an individual animal is detected and recorded.
Example (from Insentec feed bins): Radio Frequence Identification (RFID) readers detects the cow ID from her RFID transponder placed in the ear tag. The feed gate is controlled by a photocell that registers the entering time when the cow puts her head through the opening of the bin. When the cow exits, the light beam hits the transducer again, and an exit time is registered. - Specify the sensitivity of the system.
Example (from Insentec feed bins): the sensitivity of the photocell, i.e. the time between the break of the light beam when entering and the opening of the gate, can be adjusted; it was set to 0.4 s at the experimental facility from Aarhus University.
B – Test environment
- Specify the range of temperature and humidity within which the feed bins provide accurate measurements, at least according to the specifications given by the manufacturer.
- Describe the ambient conditions of the barn where the feed bins are located.
C – Animals and feeding
- Specify the breed, age, live weight, physiological status (e.g. lactation), and days in milk (lactating cows) of the animals enrolled in the trial.
- Specify the ration being offered.
- Ensure, animals are trained to use feed bins and have adapted to the ration being offered.
D – Recording of manual observations as gold standard for duration of intake
- Animals should be observed by trained observers and observer ID should be recorded.
- Direct observations or indirect observations from video recordings can be taken.
- Define the observation periods chosen and why they are chosen.
Example: Observations were conducted from 07:00 to 09:00 (right after delivery of fresh food) and from 10:00 to 13:00 to include a period when cows were mostly eating and a period when they were mostly inactive. - If utilising video, ensure that the video is of sufficient quality to see the animals’ head and its movements.
- Define an ethogram that is suited to observations of animals at feed bins.
Example, Table 1: Ethogram used to describe the feeding behaviour of cows Event Sub event Description Cow outside the feeding area The cow is outside the feeding area/feed bin, and the gate is closed. Entering The cow puts her head above the closed gate, and the gate opens. Eating, feed gate down, head in the feed bin Head angled down, taking a bite Muzzle not visible over the edge of the feed bin. Chewing Head elevated, muzzle visible over the edge of the feed bin, sideways jaw movements. Not chewing Head elevated, muzzle visible over the edge of the feed bin, no sideways movement of the jaw. Other Head elevated, muzzle visible over the edge of the feed bin, any other behaviours not listed above (feed tossing, licking the bars etc.). Exiting The cow moves back, her head goes back behind the opened gate, gate starts to close.
E – Sample size
- To calculate the sample size needed, use a previous dataset to run a power calculation. For instance, in R, use pwr.t.test, R Core Team 2017 (R Foundation for Statistical Computing, Vienna, Austria) with the following function:
\(\small apply(X \qquad \enspace \enspace \ = data.frame(q=(mq*(seq(0.05,0.15,0.01)))/sq), \\ \enspace \ \ \quad \small MARGIN= 1, \\ \enspace \ \quad \ \small FUN \quad \quad = function(q) \{pwr.t.test(d=q,power=p)\})\)
where q = Cohen’s d; mq = mean for the sample population; the sequence 0.05–0.15 represents difference from the mean (in %) that we want to detect; sq = standard deviation for the sample population and p = the level of power to be tested.
Cohen’s d is calculated as:
\(\frac{ (\textit{% difference from } M_1) \times M_1 }{\textit {pooled standard deviation}}\)
where M1 equals the mean of the sample population. - Test data for each quartile with a power of 0.5, 0.6, 0.7 and 0.8, and for 5–15% difference from the means.
Example: From previous study using Insentec RIC (roughage intake control) feed bins, for a power of 0.8, approximately 1.330 visits are required to detect differences of 5%, and for a power of 0.5, approximately 650 visits are required (Figure 1).
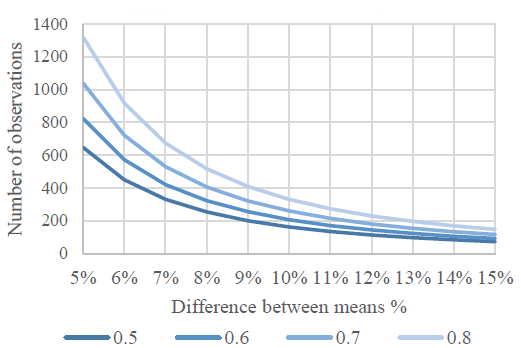
Figure 1: Number of observations needed to detect differences between observed and measured means by 5 to 15% for a power of 0.5, 0.6, 0.7 and 0.8
F – Analyses
- Even when clocks are synchronised on universal time, there can be a delay between the data recorded from feed bins and those from video observations, due to the time needed to process the data (e.g. time to label the videos manually). It is essential to check for systematic deviations between the times provided in feed bin data and those from observations by comparing the time provided for the start of each feed bin visit.
- Data should only be used if it shows a complete visit, e.g. by disregarding data if the animal was already at the feed bin at the beginning of the observations or if the animal was still at the feed bin at the end of the observations.
- The duration of feed bin visits should be calculated from observations and from the feeding system by working out the difference between the timestamps for entrering and exiting the feed bin. To clean the data set, any data which shows feed bin visits with a very short total duration (<10 s) should be removed, as should the top 1% of the longest durations.
- The difference between visit duration taken from observations and from the feeding system should be compared using a mixed model, including cow ID as random factor. You may run separate calculations for short and long visits. To do so, visit duration intervals can be decided according to quantiles of visit duration calculated from observations. To check if the difference varies with visit duration, the interval of visit duration (e.g. short, medium and long) should be included as a fixed factor.
Example: The performance of three types of feed bins was analysed: Insentec, BioControl and MooSystem. The duration of the visit (short, <150 s; medium, 150–599 s; or long, ≥600 s) affected the difference between the visit duration measured by the feed bins and that measured via observation (Table 2). The difference was smaller for short visits than for medium and long visits. The confidence interval was greatest for the long visits and shortest for the medium visits, and greater for Biocontrol than for the Insentec feed bins. The Biocontrol and Insentec overestimated the visit duration whereas Moosystem feed bins underestimated it.Table 2: LSMeans ± standard error (SE) and 95% confidence intervals for the difference in visit duration, calculated from observations and from feed bins data. LSMeans ± SE (s) 95% confidence intervals F-value P-value Insentec −0.21 ± 0.14a −0.49 0.060 38.66 <0.001 Biocontrol −2.63 ± 0.29b −3.20 −2.056 Moosystem 0.40 ± 0.19c 0.019 0.77 Short −0.50 ± 0.17a −0.83 −0.16 4.28 <0.05 Medium −1.03 ± 0.15b −1.32 −0.74 Long −0.92 ± 0.21b −1.33 −0.52 a,b within blocks and columns, values with no common superscript differ significantly (P<0.05) - Eating duration should be calculated from observations. Calculations will depend on the ethogram chosen.
Example: According to the Ethogram defined in Table 1, eating duration was calculated by adding the duration of two observations of head angled down, taking a bite and chewing behaviours. - To determine whether visit duration (measured by the feed bin) can be used to predict eating duration, a mixed model, including the visit duration as fixed effects and cow ID as random effect, should be used. To analyse if visit duration has the same effect on eating duration, dependent on how long the visit is (e.g. short, medium and long), a regression plot, including R2 values and 95% confidence interval, should be used.
Example: The slope between eating duration and visit duration was close to 1 for all visit duration intervals, suggesting a precise estimate of eating time independent of the duration of the visit (Table 3).
Table 3: Eating duration as explained by duration of feed bin visit Visit duration intervals Estimate 95% confidence intervals P-values Intercept Slope Intercept Slope Intercept Slope Short
(<150 s)−9.1±3.11 1.00±0.035 −15.4 −2.78 0.94 1.07 <0.01 <0.001 Medium
(150–599 s)−12.0±5.88 0.98±0.016 −23.6 −0.14 0.95 1.02 <0.05 <0.001 Long
(≥600 s)−24.7±9.57 1.00±0.011 −5.33 0.98 0.98 1.02 <0.05 <0.001
References
[1] Mesgaran SD, Kuhla B, Humphries D, Weisbjerg M, Lund P, Kennedy E, O’Donovan M, Liddane M, Galvin N, Dijkstra J, Baumont R. Feed and water intake. In: Mesgaran SD, Baumont R, Munksgaard L, Humphries D, Kennedy E, Dijkstra J, Dewhurst R, Ferguson H, Terré M, Kuhla B (eds). Methods in cattle physiology and behaviour research - Recommendations from the SmartCow consortium. Cologne: PUBLISSO; 2020. DOI: 10.5680/mcpb002[2] Chapinal N, Veira DM, Weary DM, von Keyserlingk MA. Technical note: validation of a system for monitoring individual feeding and drinking behavior and intake in group-housed cattle. J Dairy Sci. 2007 Dec;90(12):5732-6. DOI: 10.3168/jds.2007-0331
[3] Pahl C, Hartung E, Grothmann A, Mahlkow-Nerge K, Haeussermann A. Suitability of feeding and chewing time for estimation of feed intake in dairy cows. Animal. 2016 Sep;10(9):1507–12. DOI: 10.1017/S1751731115001366
[4] Bouchon M, Bach A, Meunier B, Ternman E, Van Reenen K, Veissier I and Munksgaard L. A checklist to validate sensor output for the recording of cattle behaviour. In: Mesgaran SD, Baumont R, Munksgaard L, Humphries D, Kennedy E, Dijkstra J, Dewhurst R, Ferguson H, Terré M, Kuhla B, (editors). Methods in cattle physiology and behaviour research - Recommendations from the SmartCow consortium. Cologne: PUBLISSO; 2021. DOI: 10.5680/mcpb014
[5] Munksgaard L. SmartCow Deliverable 7.2 – Test of guidelines. Available at https://www.smartcow.eu/wp-content/uploads/2020/10/D7.2.pdf